Figure 6.

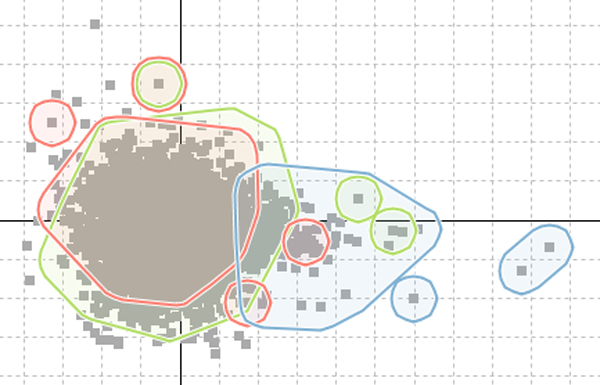
Displaying gene groupings in the scatter-plot. Smoothed outline shapes with transparent shading allow the effective visualization of up to four groups simultaneously.

Displaying gene groupings in the scatter-plot. Smoothed outline shapes with transparent shading allow the effective visualization of up to four groups simultaneously.