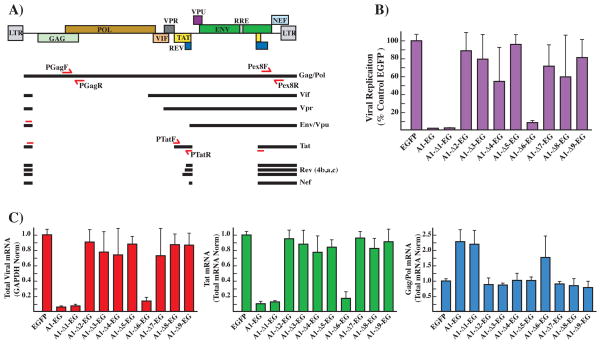
Fig. 4.
(A) Schematic representation of the pNL4-3 proviral clone. The relative position of the viral genes is indicated on the map on top. The main mRNAs generated from the single viral transcript are indicated. Locations of the primers utilized in the qPCR assays to amplify the total viral mRNA (Pex8F, Pex8R) and specific for the gag/pol (PGagF, PGagR) and tat (PTatF, PTatR) mRNAs are indicated. (B) Viral replication assay. HEK-293 cells were co-transfected with the proviral clone pNL4-3, the control pEGFP or the indicated hnRNP A1-EGFP fusion clone. TZM-bl reporter cells were infected with the supernatant from HEK-293 cells 72 hours after transfection. Luciferase activity was measured 48 hours after infection and it is directly proportional to the amount of virion contained in the infection supernatant. 100% replication was defined as luciferase activity obtained by incubating the indicator cell line with the supernatant from the HEK-293 cells transfected with the viral clone pNL4-3 and the pEGFP control plasmid. (C) qPCR analysis of viral transcripts. Each graph summarizes the quantification by qPCR analysis of the indicated viral mRNA species extracted from 293T cells transfected with the proviral clone pNL4-3 and the indicated expression clone. The amount of each mRNA species generated in the transfection containing the control pEGFP was assigned the value 1. Total viral mRNA expression was normalized for expression of the GAPDH housekeeping gene. Expression of the gag/pol and tat mRNAs relative to the total amount of viral transcript was calculated by normalizing the amount of specific transcripts for the total amount of viral mRNA in each assay.

