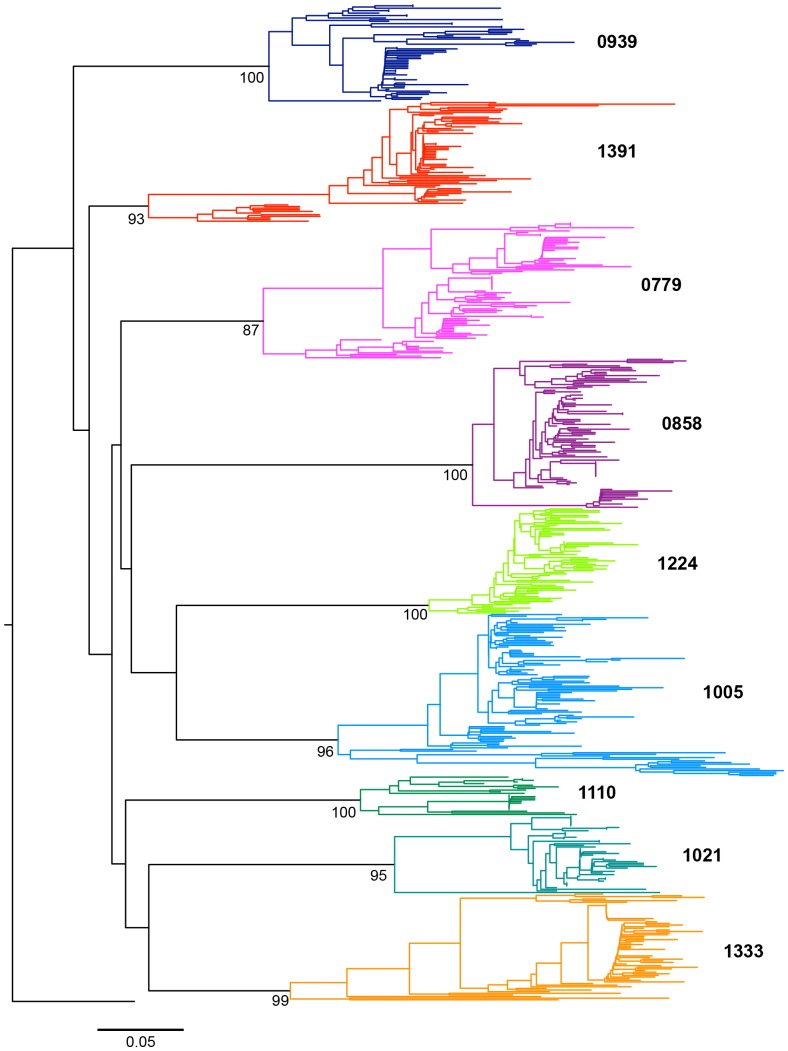
Figure 1. Rooted phylogenetic tree of the entire dataset (mothers and children of the nine pairs), reconstructed specifying a GTR+Gamma model.
Each color represents a different pair. The external group (black) belongs to the CRF01_AE subtype. The scale corresponds to 5% of divergence between sequences. The bootstrap values are indicated.

