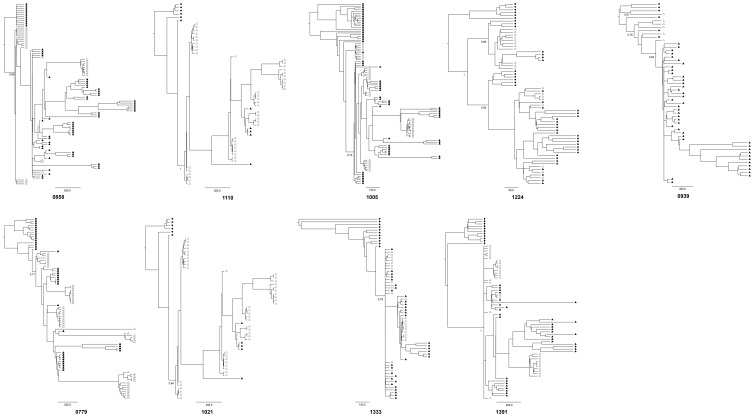
Figure 2. Bayesian MCMC phylogenetic trees.
Maternal and child sequences are represented by diamonds and triangles respectively. Filled and unfilled symbols refer to DNA and RNA samples respectively. Time scale expressed in days is indicated below each tree. Posterior probabilities of the main lineages are indicated at the root.

