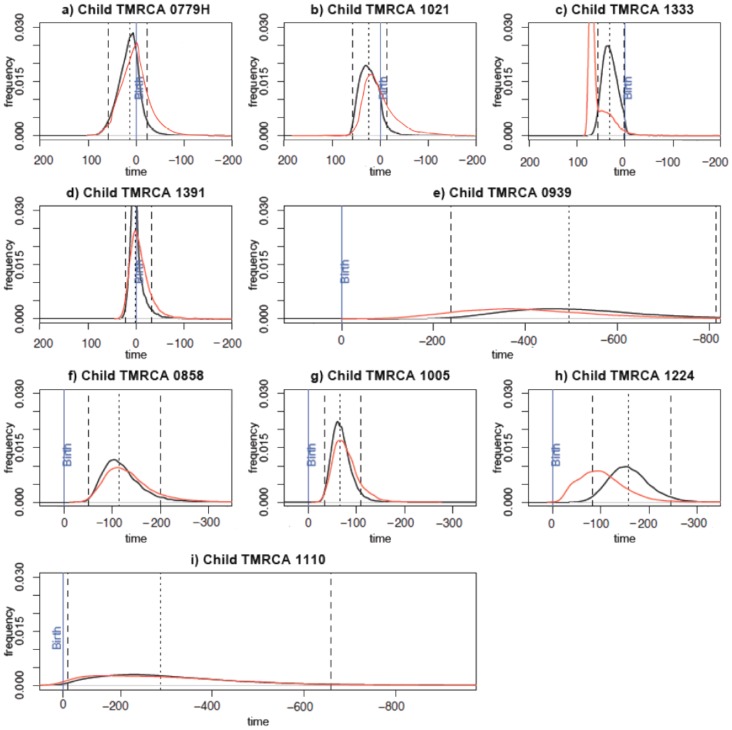
Figure 4. Comparative TMRCA posterior distributions.
Red curves correspond to posterior distribution of children-only data. Black curves refer to posterior distribution of pair (mother and child) data. Dashed lines represent the 95% confidence interval. Median (hashed line) is indicated. The blue vertical line indicates birth and times on the x axis are expressed in days since birth. Y axis: TMRCA density; X axis: time in days. a to e: infants infected intrapartum. f to i: infants infected in utero.

