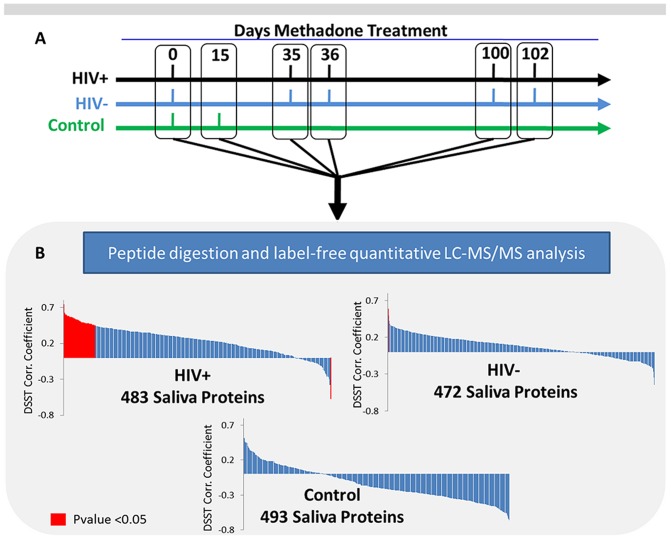
Figure 1. Overview of clinical saliva sample collection and proteomic analysis.
A) Timeline of the three participant cohorts and their respective days of saliva sample collection and DSST testing. The control population was HIV− and heroin independent so no methadone treatment was initiated at day 0. B) Graph of DSST correlation with all identified and quantified saliva proteins from each respective group after sample collection, processing, instrument and data analysis. Proteins shown in red are those which pass the Benjamini-Hochberg corrected P-value of <0.05.

