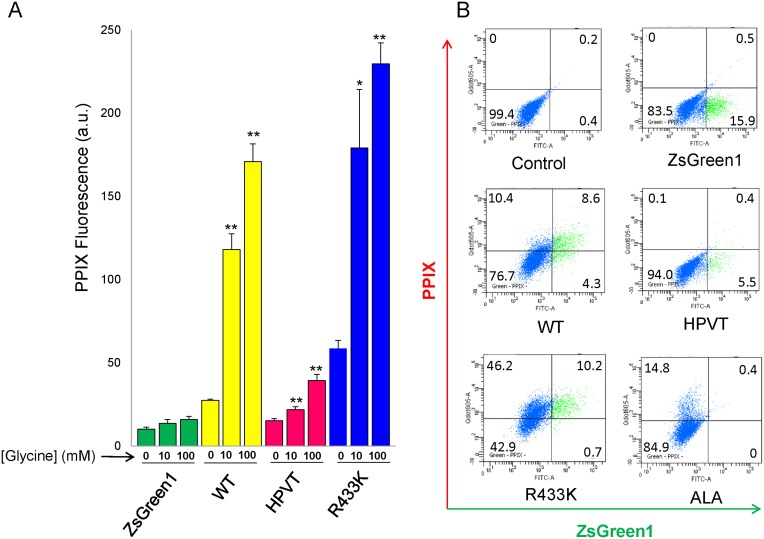
Figure 3. Glycine supplementation of culture medium increases PPIX accumulation in HeLa cells expressing murine wild-type, HPVT, and R433K ALAS2.
(A) PPIX fluorescence measured by flow cytometry 24 hours after transfection and 18 hours after supplementing culture medium with 10 mM glycine or 100 mM glycine. The culture medium of the corresponding control cells and control transfected cells was not supplemented with glycine. Normalized PPIX fluorescence values were obtained by dividing the mean PPIX fluorescence by the mean ZsGreen1 fluorescence for each cell population. Mean PPIX fluorescence values are representative of three separate experiments ± standard deviation (*p<0.05 and **p<0.01, Student’s t-test) [a.u., arbitrary units]. (B) ZsGreen1 fluorescence versus PPIX fluorescence in HeLa cell populations supplemented with 100 mM glycine as measured by flow cytometry. In each dot plot, cells in the green-fluorescent range are represented in green and to the right of the vertical black line, while cells that are not green-fluorescent are in blue. Cells that are red-fluorescent due to PPIX accumulation are above the horizontal black line, while cells that are not red-fluorescent are below the horizontal black line. The percentage of cells in each quadrant is written in the corners of each dot plot. “Control” refers to non-transfected HeLa cells.

