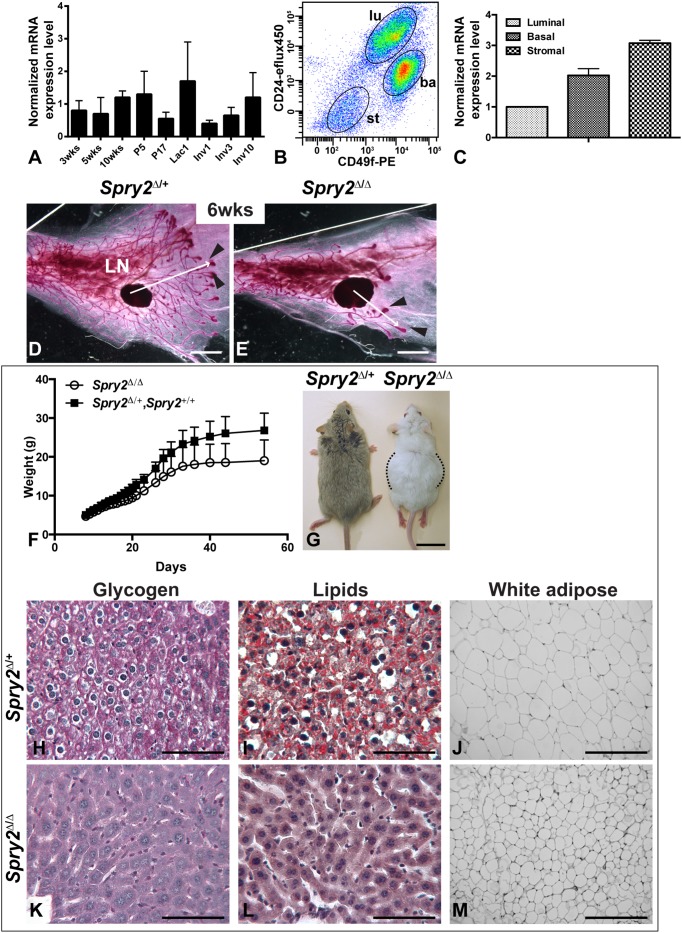
Figure 1. Spry2 null mice show stunted epithelial branching due to malnourishment.
(A–C) Spry2 mRNA expression as detected by quantitative RT-PCR (qPCR). (A) Spry2 mRNA expression was measured by qPCR using RNA harvested from mammary glands from female mice at 3-weeks, 5-weeks, and 10-weeks of age as virgins, during pregnancy (P) on day 5 and 17, on day 1 of lactation (Lac), and on day 1, 3, and 10 of involution (Inv). Spry2 expression at 3-weeks was set as base value against which other stages were compared. Abbreviations: wks, weeks; P, pregnancy; L, lactation; Inv, involution. (B, C) MECs were sorted based on their expression of CD24 and Integrin-α6 (CD49f). CD24medCD49fhi cells were basal (ba), whereas CD24hiCD49fl°w cells and CD24l°wCD49fl°w were luminal (lu) and stromal (st), respectively. RNA was harvested from the three cell partitions to generate DNA templates for qPCR reactions (C). (D, E) The mammary branching tree at 6-weeks of age, as revealed by Carmine Red staining of glands in wholemount. Proximal (close to the nipple) is to the left and distal is to the right. Arrowheads indicate TEBs at the tips of invading mammary epithelium, which persist until branching morphogenesis ceases in adult glands. Arrows indicate the extent of ductal penetration in the fat pad. Note epithelial branching was severely stunted in (E) mutant (Spry2 Δ/Δ; n = 8) mice when compared with (D) control (Spry2 Δ/+; n = 12) mice. Scale bars: 2 mm. Abbreviation: epi, epithelium; st, stroma; LN, lymph node. (F–M) Spry2 null mice showed growth retardation (F, G) and an insufficiency in energy storage (H–M). (F) Growth curve of pups born from Spry2 Δ/+ crosses. Weights between Spry2 Δ/+ (n = 15) and Spry2 +/+ (n = 4) mice were indistinguishable and combined. Values shown are the mean ± SD for each data point. (G) Dorsal view of typical appearances of Spry2 Δ/+ and Spry2 Δ/Δ mice at 12-weeks of age. Note Spry2 Δ/Δ mice were shorter than normal and had enlarged midsection (flanked by dotted black lines) due to distended intestines (not shown). Scale bars: 2 cm. (H–M) Glycogen and lipid storage, as revealed by Periodic Acid-Schiff and Oil-Red-O staining, respectively, and histology of white adipose tissue from Spry2 Δ/+ (H–J) and Spry2 Δ/Δ mice (K–M). Note that Spry2 Δ/Δ mutant liver lacked glycogen (K) and lipid storage (L) as was evident in control liver (purple-magenta color in H and red droplets in I); moreover, adipocytes from white adipose tissue in Spry2 Δ/Δ mutant (M) mice were smaller than normal (J). Scale bars: 100 μm.

