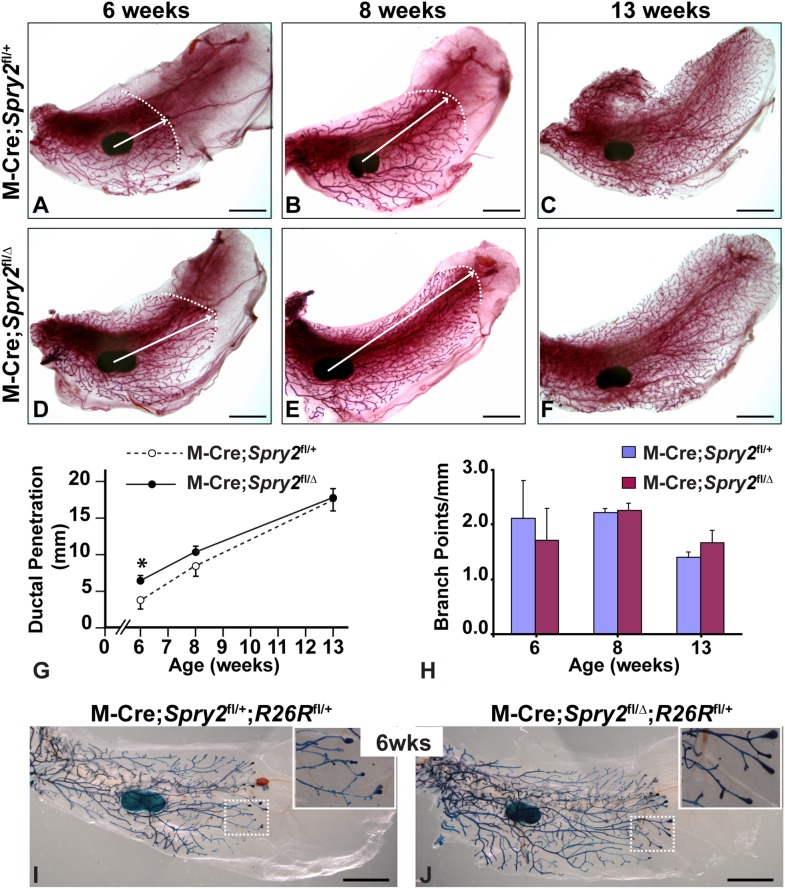
Figure 2. Conditional removal of Spry2 function from mammary epithelium causes accelerated epithelial invasion.
(A–H) The mammary branching tree from the #4 glands at the postnatal stages indicated, as revealed by Carmine Red staining of glands in wholemount. (A–C) glands from control (M-Cre;Spry2 fl/+) mice; (D–F) glands from mutant (M-Cre;Spry2 fl/Δ) mice. (A–F) Arrows indicate the extent of ductal penetration in the fat pad. Dotted white line illustrates the epithelial invasion front. (G, H) Quantitative comparisons of ductal penetration and branch point formation between control and mutant glands. At 6 weeks, ductal penetration measurements were 3.8±1.3 (control, n = 10) and 6.5±0.6 (mutant, n = 6); at 8 weeks, the measurements were 8.5±1.5 (control, n = 4) and 10.3±0.8 (mutant, n = 6); at 13 weeks, they were 17.4±1.5 (control, n = 8) and 17.8±1.1 (mutant, n = 14). Measurements of branching points were 2.1±0.7 (control) and 1.7±0.6 (mutant) at 6 weeks, 2.2±0.1 (control) and 2.2±0.2 (mutant) at 8 weeks, and 1.4±0.1 (control) and 1.7±0.2 (mutant) at 13 weeks. Values shown are the mean ± SD for each data point: *, P<0.05, unpaired, two-tailed Student’s t test. N is the number of mammary glands examined. (I, J) Assays for β-GAL activity in wholemount of control (I, M-Cre;Spry2 fl/+;R fl/+) and mutant (J, M-Cre;Spry2 fl/Δ;R fl/+) glands at 6-weeks of age. The dashed boxes demarcate the portions of branching trees that are shown at higher magnification in insets. β-GAL expression marks cells derived from those in which MMTV-Cre-mediated recombination occurred. Note that β-GAL-positive Spry2 null cells were well represented in the distal branching network, including TEBs of mutant glands (J, n = 18). Scale bars: 2.5 mm.

