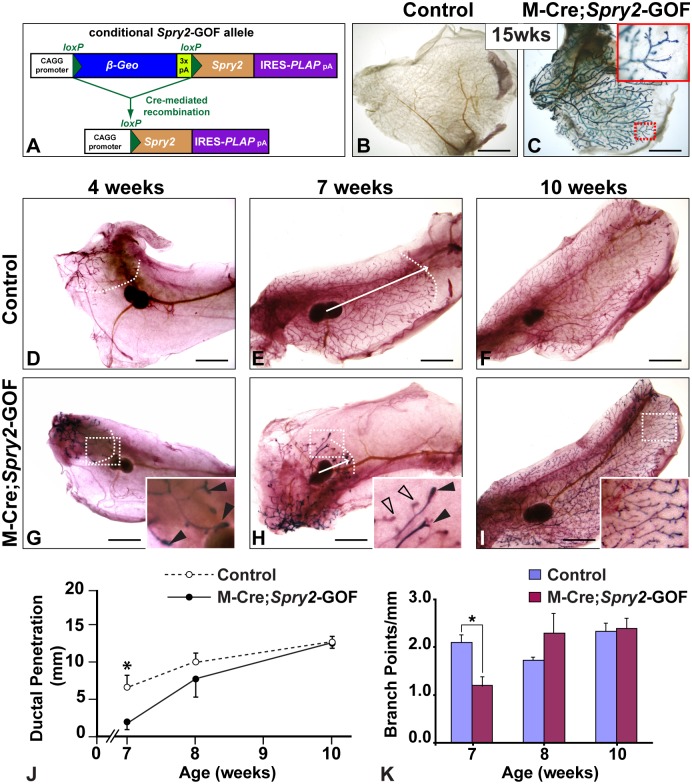
Figure 4. Gain of Spry2 function in the mammary epithelium causes retarded epithelial branching.
(A) Schematic diagram depicting the Spry2-GOF transgene. The β-Geo gene was driven by the CAGG promoter and followed by a triple poly-adenylation sequence (3x pA). Upon Cre-mediated recombination, the β-Geo gene was deleted and the mouse Spry2 and human placental alkaline phosphatase (PLAP), constructed as a bi-cistronic mRNA containing an internal ribosome entry site (IRES) directing PLAP translation, were expressed. (B–C) Assay for PLAP activities in control (M-Cre or Spry2-GOF) and mutant (M-Cre;Spry2-GOF) #3 glands from adult female mice at 15-weeks of age. Note PLAP activities were detected in mutant (C) but not in control glands (B). The area in the dashed red box is highlighted in a close-up picture in the inset, illustrating the branching network that was positive for PLAP activities. (D–I) The mammary branching tree from #4 glands at the postnatal stages indicated. Samples were assayed for PLAP activities and were then stained with Carmine Red. (D–F) glands from control mice; (G–I) glands from mutant mice. Arrows indicate the extent of ductal penetration in the fat pad. Dotted white line illustrates the epithelial invasion front. Insets in (G), (H), and (I) show high-magnification views of the rudimentary ductal tree (area in dashed box), illustrating only some of the mammary epithelial cells showed PLAP activities due to the mosaic activity of the M-Cre transgene. Solid arrowheads indicate TEBs from 4-week (G) and 7-week (H) mammary glands that were more heavily stained for PLAP activities than other TEBs indicated by open arrowheads (H). These data suggest that the mammary glands from the bi-transgenic mice (M-Cre;Spry2-GOF) are mosaic, containing both Cre-expressing and non-Cre-expressing cells. (J, K) Quantitative comparisons of ductal penetration and branch point formation between control and mutant glands. At 7 weeks, ductal penetration measurements were 7.0±1.9 (control, n = 6) and 1.8±1.0 (mutant, n = 6); at 8 weeks, the measurements were 9.9±1.2 (control, n = 4) and 7.7±2.3 (mutant, n = 10); at 10 weeks, they were 12.4±0.3 (control, n = 8) and 12.7±0.04 (mutant, n = 4). Measurements of branching points were 2.1±0.3 (control) and 1.2±0.2 (mutant) at 7 weeks, 1.7±0.1 (control) and 2.3±0.4 (mutant) at 8 weeks, and 2.3±0.2 (control) and 2.4±0.2 (mutant) at 10 weeks. Values shown are the mean ± SD for each data point: *, P<0.05, unpaired, two-tailed Student’s t test. Scale bars: 2.5 mm. N is the number of mammary glands examined.

