
Figure 6. Change in triglycerides by diet group.
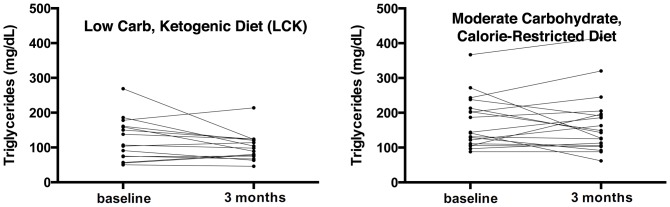
Both panels show individual lines for the course of triglycerides from baseline to 3 months after intervention initiation for each trial participant. The left panel displays this data for the low carbohydrate diet group (mean change −22.3 mg/dL), while the right presents the data for the moderate carbohydrate diet group (mean change −3.9 mg/dL).