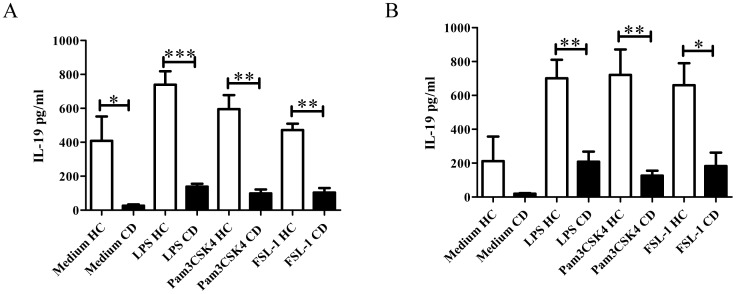
Figure 2. IL-19 production after TLR activation in PBMC cultures from active CD patients (n = 3) and HC (n = 6).
PBMC were cultured 24(A) and 48 h (B) with different TLR ligands (LPS, Pam3CSK4 or FSL-1) and IL-19 production was determined by ELISA as described in Materials and Methods. The viability of PBMC was determined by Trypan Blue (>99%). *p<0.05; **p<0.01; ***p<0.001.

