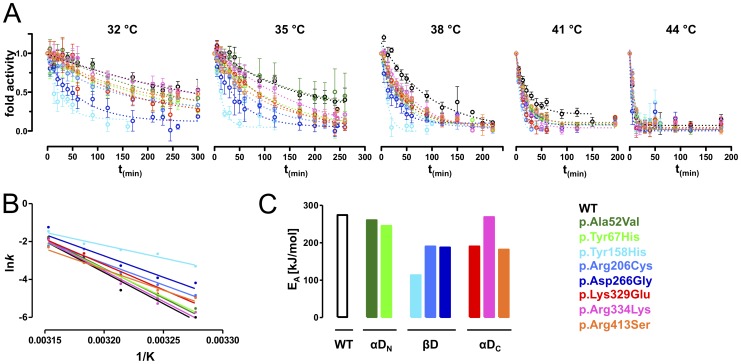
Figure 5. Kinetics of thermal inactivation.
(A) Kinetics of thermal inactivation experiments probing dynamics of heat-induced loss of function. Wild-type and variant MCAD proteins were incubated at indicated temperatures and residual activity was plotted as a function of incubation time. (B) Arrhenius Plots resulting from kinetic constants k of time-dependent thermal denaturation experiments. (C) Activation energies (EA) calculated from Arrhenius Plots reflect the energy barrier between the conformational state with full residual activity and the non-active state after application of thermal stress.

