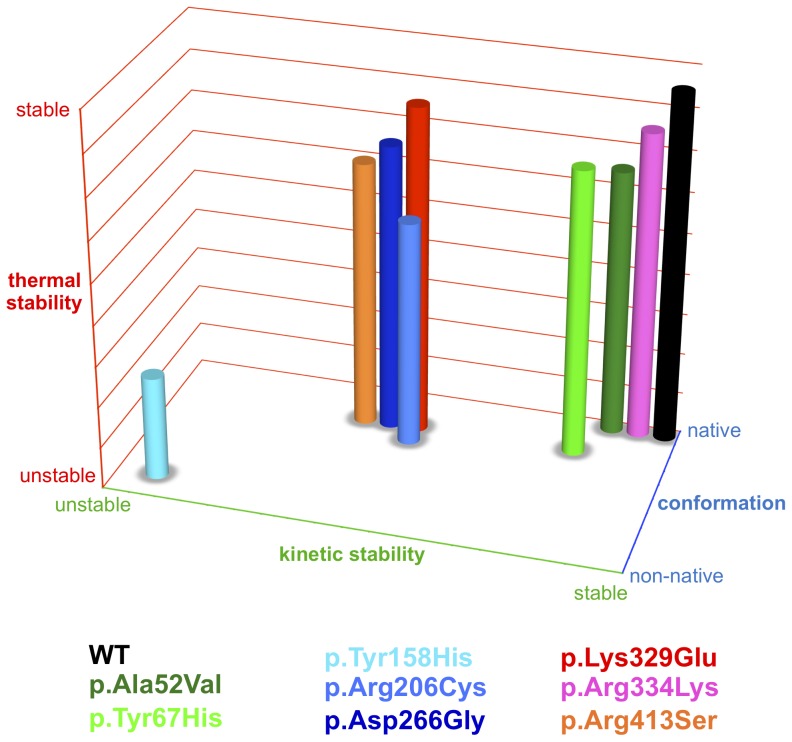
Figure 6. Molecular phenotypes of thermal, kinetic, and conformational stability.
Data derived from experiments depicted in Figures 2, 3, and 5 were combined and visualized as 3D plot. Thermal stability (y-axis) refers to midpoints of thermal denaturation determined by CD spectroscopy, FAD-DSF, and ANS-DSF. Kinetic stability (x-axis) refers to the EA determined by thermal inactivation experiments. Conformational stability (z-axis) refers to secondary structure (CD spectra), hydrophobicity (ANS fluorescence), and FAD binding capacity (intrinsic FAD fluorescence) in the absence of heat-induced stress.

