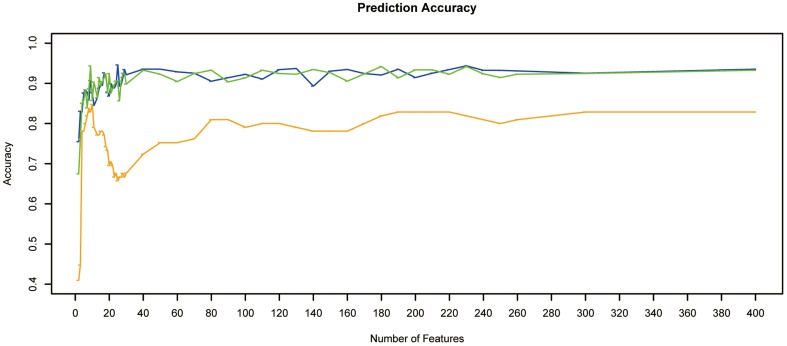
Figure 1. IFS curve of the classification of ATCs, PTCs and normal tissue samples.
The X-axis indicate the number of genes used for classification/prediction, and Y-axis is the prediction accuracies by NNA evaluated using leave-one-out (orange), 10 fold (green) and stratified 10 fold (blue) cross validation.

