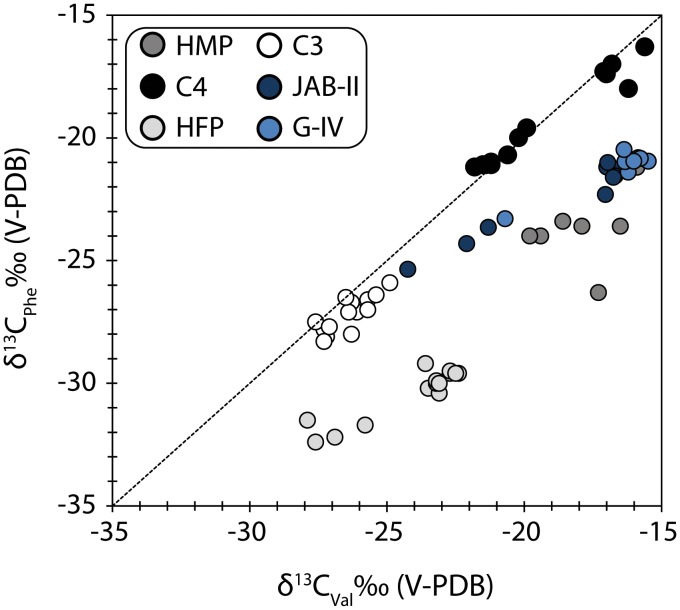
Figure 6. A biplot of phenylalanine and valine δ13C values.
The biplot distinguishes two dietary groups at Jab-II and G-IV; those with mixed marine/C3 terrestrial animal diets and those consuming high marine protein (HMP). Data from Honch et al. [28] are reported for comparison and include C4, C3 and high marine (HMP) and freshwater protein (HFP) consumers.

