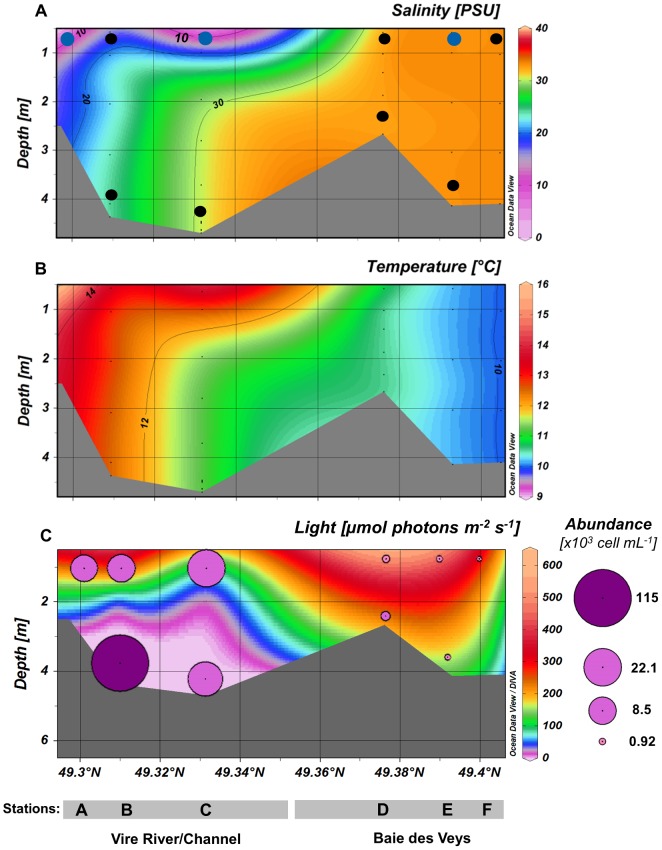
Figure 2. Profiles of salinity (A), temperature (B), irradiance and phytoplankton abundance (C) along the estuarine gradient.
(Stations A→F). Black dots on the profile (A) represent sampling points collected for the global phytoplankton analysis by microscopy, and the blue dots indicate those analyzed by both microscopy and clone library approaches. A logarithmic scale was used for the representation of phytoplankton cell abundance on the profile of irradiance(C).

