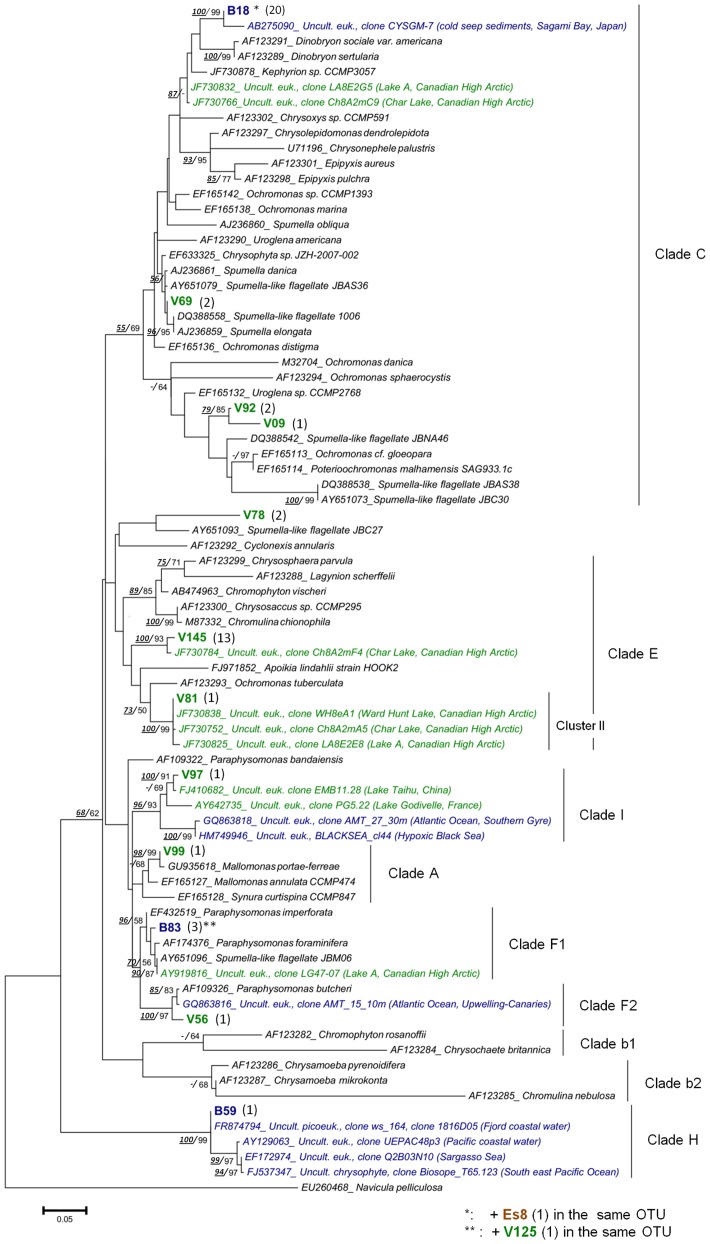
Figure 4. Maximum likelihood (ML) tree showing the position of the Chrysophyte OTUs.
OTUs were obtained from the VIRE River (V), the ESTUARY (Es) and the BAY (B) clone libraries. Tree construction was based on an alignment of 79 partial sequences (ca 500 align positions). The diatom Navicula pelliculosa was used as outgroup. The number of clones per OTU is indicated in brackets. Sequences from cultured taxa appear in black and environmental sequences in green (freshwater), blue (marine) or brown (brackish/estuary). Bootstrap values (>50%) obtained from the neighbor-joining tree and those from ML tree are indicated (NJ /ML).

