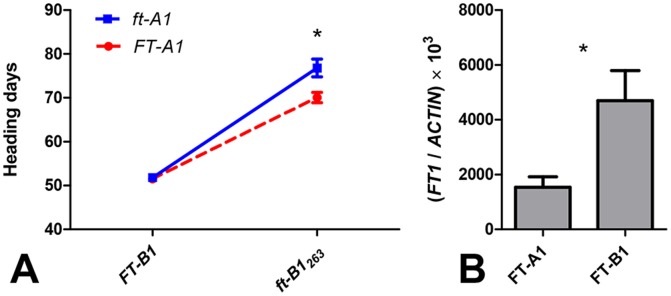
Figure 4. ft1 TILLING mutants.

(A) Interaction plot showing the effect of ft-A1 and ft-B1 263 mutations on heading time in a BC1F2 population segregating for both genes. Differences in heading time between the FT-A1 alleles were significant only for the homozygous ft-B1 263 mutant plants. (B) Transcript levels of FT-A1 and FT-B1 homoeologs in three-week-old wild type Kronos. The expression level of FT-B1 was significantly higher than that of the FT-A1 (P = 0.017). ACTIN was used as an internal control. Samples were harvested at 10∶00 a.m. Asterisks indicate P values of Student’s t-tests: * = P<0.05.
