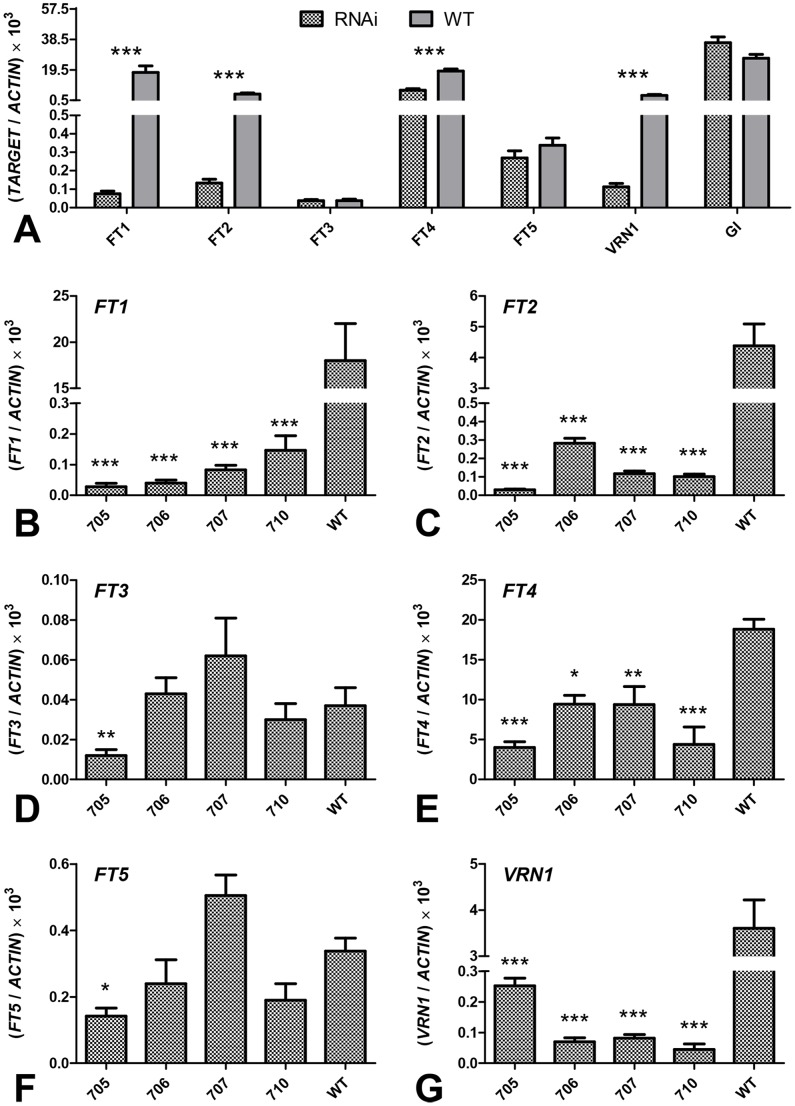
Figure 6. Transcript levels of target genes in T0 Brachypodium FT1 RNAi lines.
(A) Comparison between the average of four transgenic plants (RNAi) and the wild type control using contrasts. (B–G) Comparison between individual transgenic lines and wild type using Dunnett’s test. (B) FT1, (C) FT2, (D) FT3, (E) FT4, (F) FT5, (G) VRN1 (gene regulated by FT1). ACTIN was used as the internal control. Samples were harvested at 12∶00 p.m., approximately one week after wild type control plants began to flower. Asterisks indicate P values: * = P<0.05; ** = P<0.01; *** = P<0.001.

