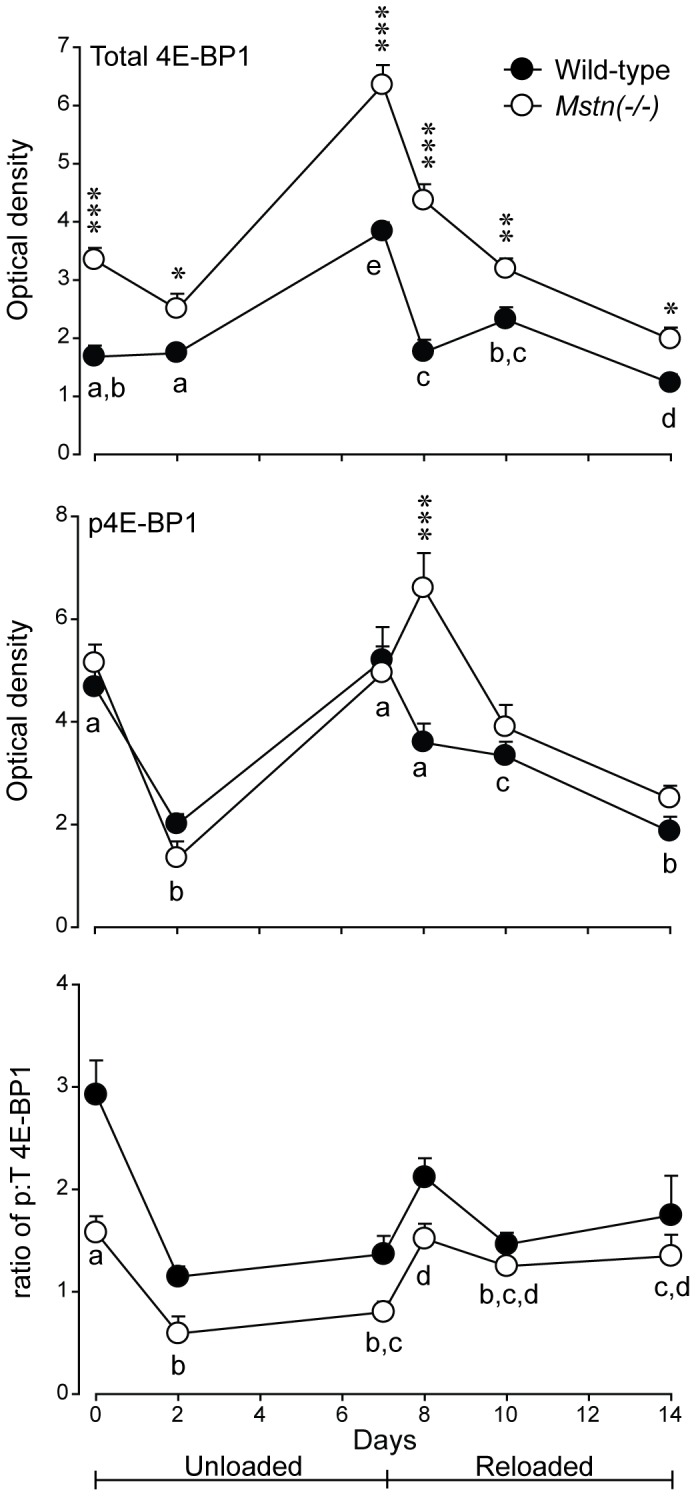
Figure 7. Abundance (mean+sem) of total (T) 4E-BP1, phosphorylated (p) 4E-BP1 and the ratio of p:T 4E-BP1 in gastrocnemius muscles of Mstn(−/−) and wild-type mice (n = 6 per genotype and day) during seven days of unloading and seven days of reloading.

Asterisks denote significant differences between genotypes at the days indicated (*P<0.05, **P<0.01, ***P<0.001). Unlike letters denote significant differences (P<0.05) across days (independent of genotype).
