
Figure 3. Change of CV in response to infection.
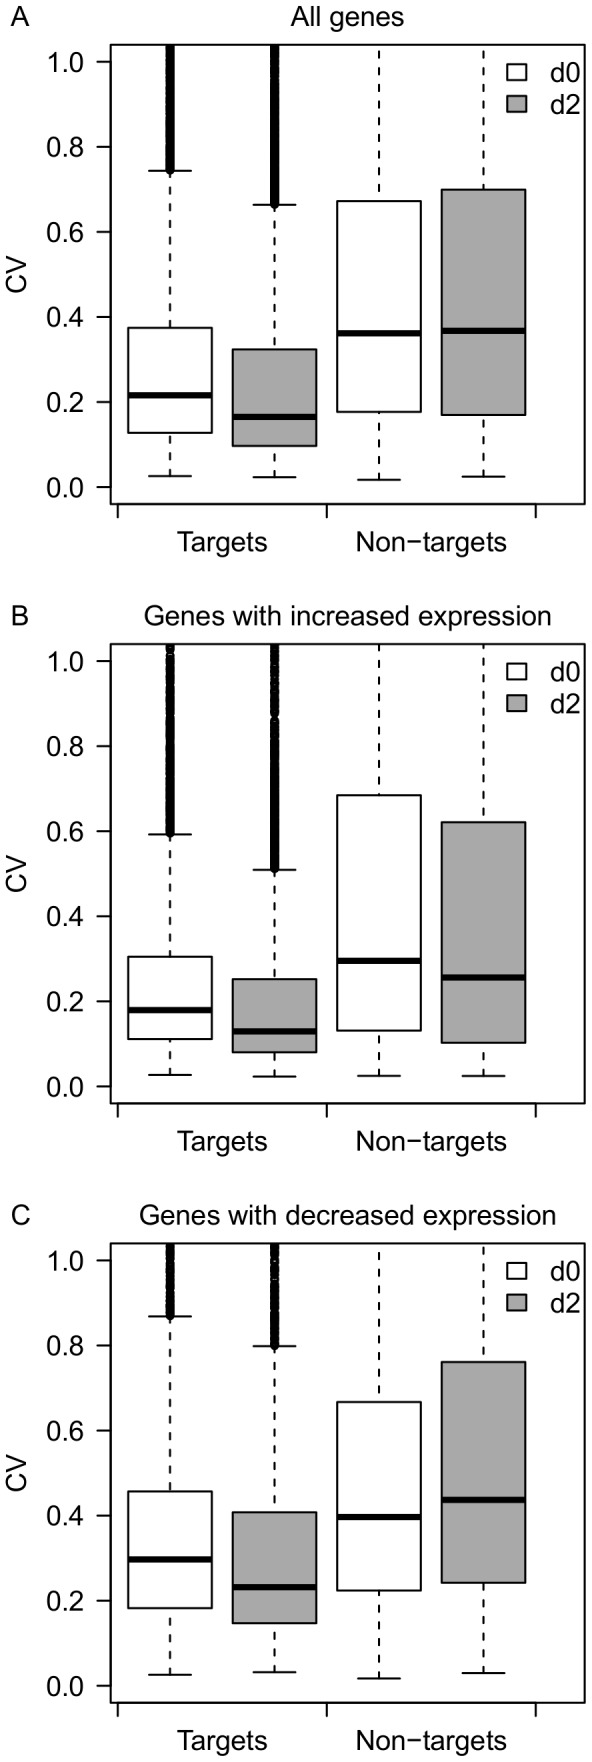
(A) Boxplot of CVs for predicted miRNA targets (n = 7962) and non-miRNA-targets (n = 7211) before and after infection. (B) Boxplot of CVs for predicted miRNA targets (n = 2947) and non-miRNA-targets (n = 4029) with decreased expression after infection. (C) Boxplot of CVs for predicted miRNA targets (n = 5015) and non-miRNA-targets (n = 3182) with increased expression after infection.