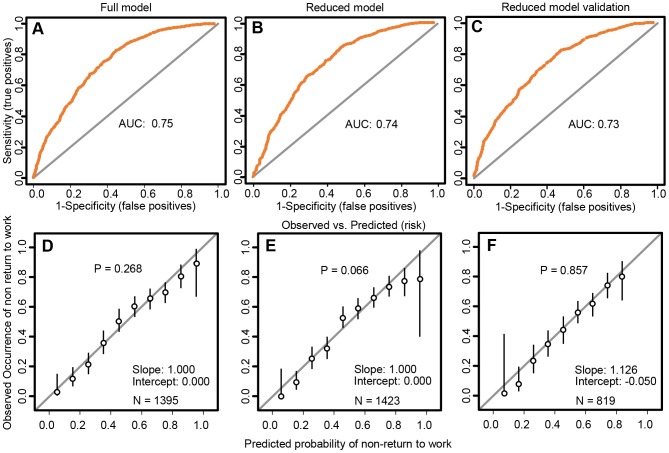
Figure 2. Receiver Operating Characteristic Curves (upper panel) and calibration plots (lower panel).
Receiver operating characteristic curves with areas under the curves (upper panel A–C) and calibration plots (lower panel, D–F). The leftmost column is from the full model in the development sample, the middle column shows the reduced model in the development sample and the right column shows the temporal external validation of the reduced model. AUC = area under the curve. N = total number of participants with complete data for the variables in the model.

