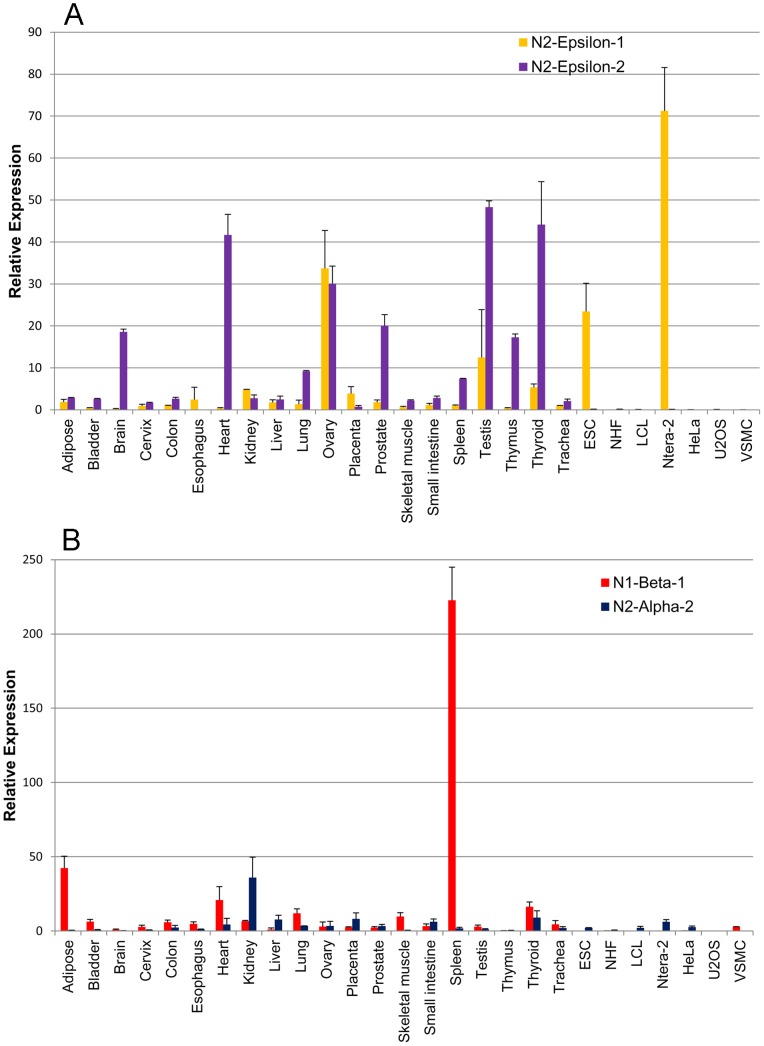
Figure 3. Tissue-specific expression of nesprin-1-beta-1, nesprin-2-alpha-2 and the two nesprin-2-epsilon isoforms.
Quantitative PCR to show mRNA expression of nesprin isoforms relative to the expression of two endogenous house-keeping controls. Charts represent the mean relative expression ± SEM, measured in cDNA preparations from 20 human tissues and 7 cell lines. These values are given in Tables S3 and S4 in File S1. Bar charts show relative expression of (A) nesprin-2-epsilon-1 and nesprin-2-epsilon-2, and (B) nesprin-1-beta-1 and nesprin-2-alpha-2.

