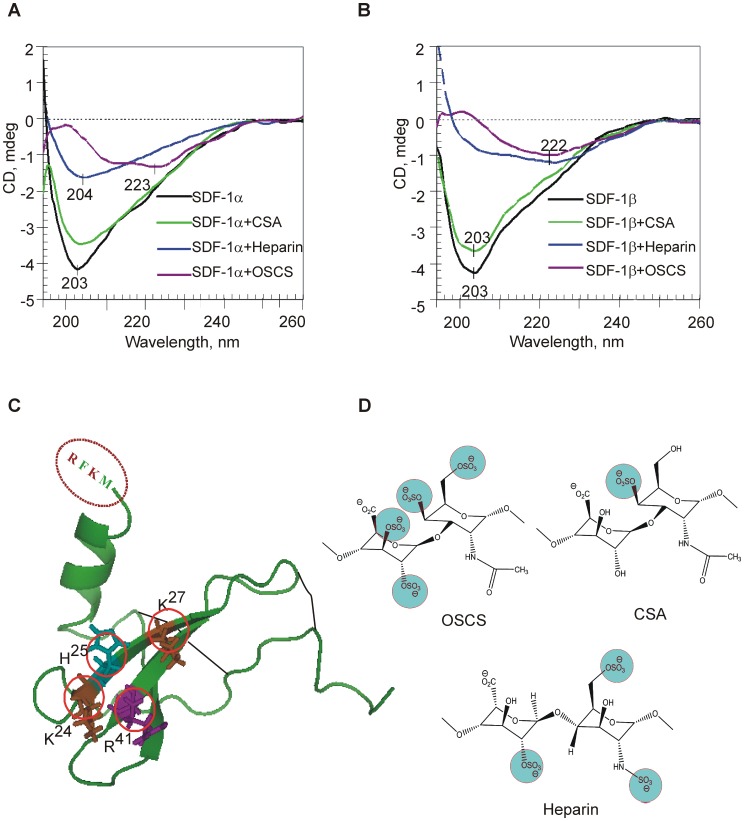
Figure 2. OSCS binding leads to conformational changes of SDF-1.
Conformational changes were shown by far-UV CD spectra of 12.5 μM SDF-1α (A) and SDF-1β (B) in PBS alone (black line), and in the presence of CSA (green), heparin (blue) and OSCS (purple) at the protein: GAG molar ratio of 2∶1. The CD spectra of GAGs (6 μM) alone are negligible (zero line). (C) Crystal structure of SDF-1α [PDB code 1SDF] with basic amino acid residues K24, H25, K27, and R41 (Hot Spots, in red circles) [48], two disulfide bonds (indicated in black lines), and the four additional amino acid residues present in the C-terminus of the SDF-1β, RFKM. (D) The structure of disaccharide repeats of OSCS, heparin and CSA [2], [49]. The negatively charged sulfate units (in blue circles) can bind with positively charged “hot spots” of SDF-1. The highly negatively-charged OSCS is likely to have the best fit with SDF-1 hot spots. The data in A & B are representative of three independent experiments.

