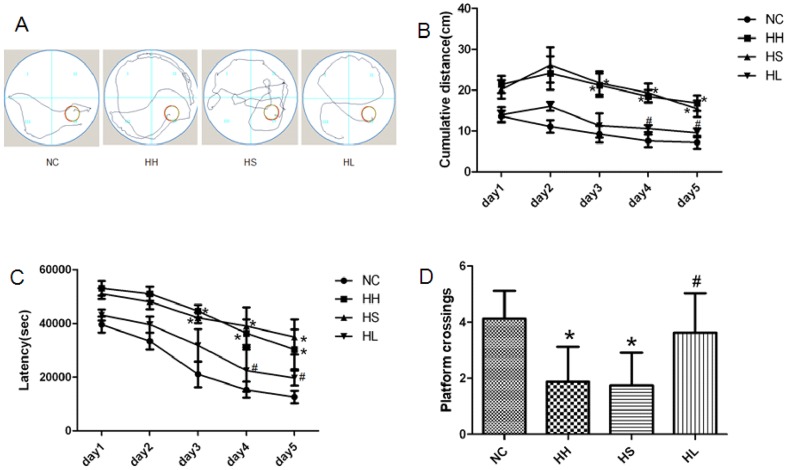
Figure 1. Performance of the rats in the Morris water maze.
(A) The pathway taken to search for the hidden platform. (B) Cumulative distance to reach the platform. (C) Latency to find the platform. (D) Number of platform crossings. Values are expressed as mean ± SD. * p<0.05 when compared to the NC group, and # p<0.05 when compared to the HH group. NC = normal control group; HH = hypoxia-hypercapnia group; HS = hypoxia-hypercapnia+DMSO and PBS group; HL = hypoxia-hypercapnia+lovastatin.

