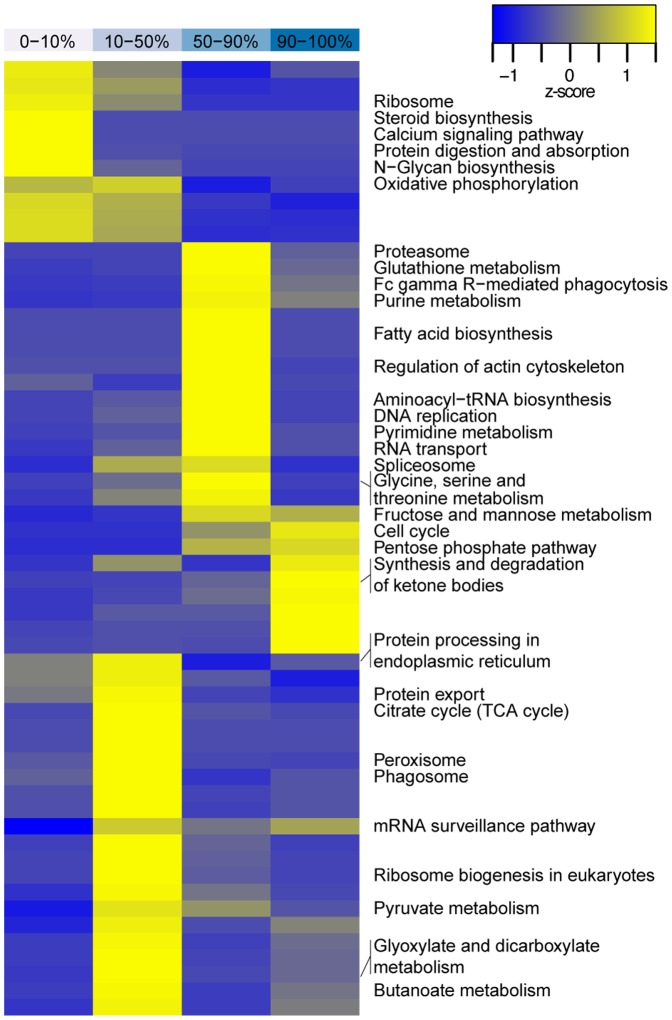
Figure 4. Proteomic phenotyping of the influenza A/PR/8 infected MDCK cell proteome at 10 hrs p.i. using KEGG annotations.
Quantiles of the quantification histogram are indicated at the top of the heatmap. Each quantile was separately analyzed for KEGG pathways and clustered for the z transformed p values. The most prominent representatives of all over-represented biological processes of each quantile were selected and annotated in the right panel.

