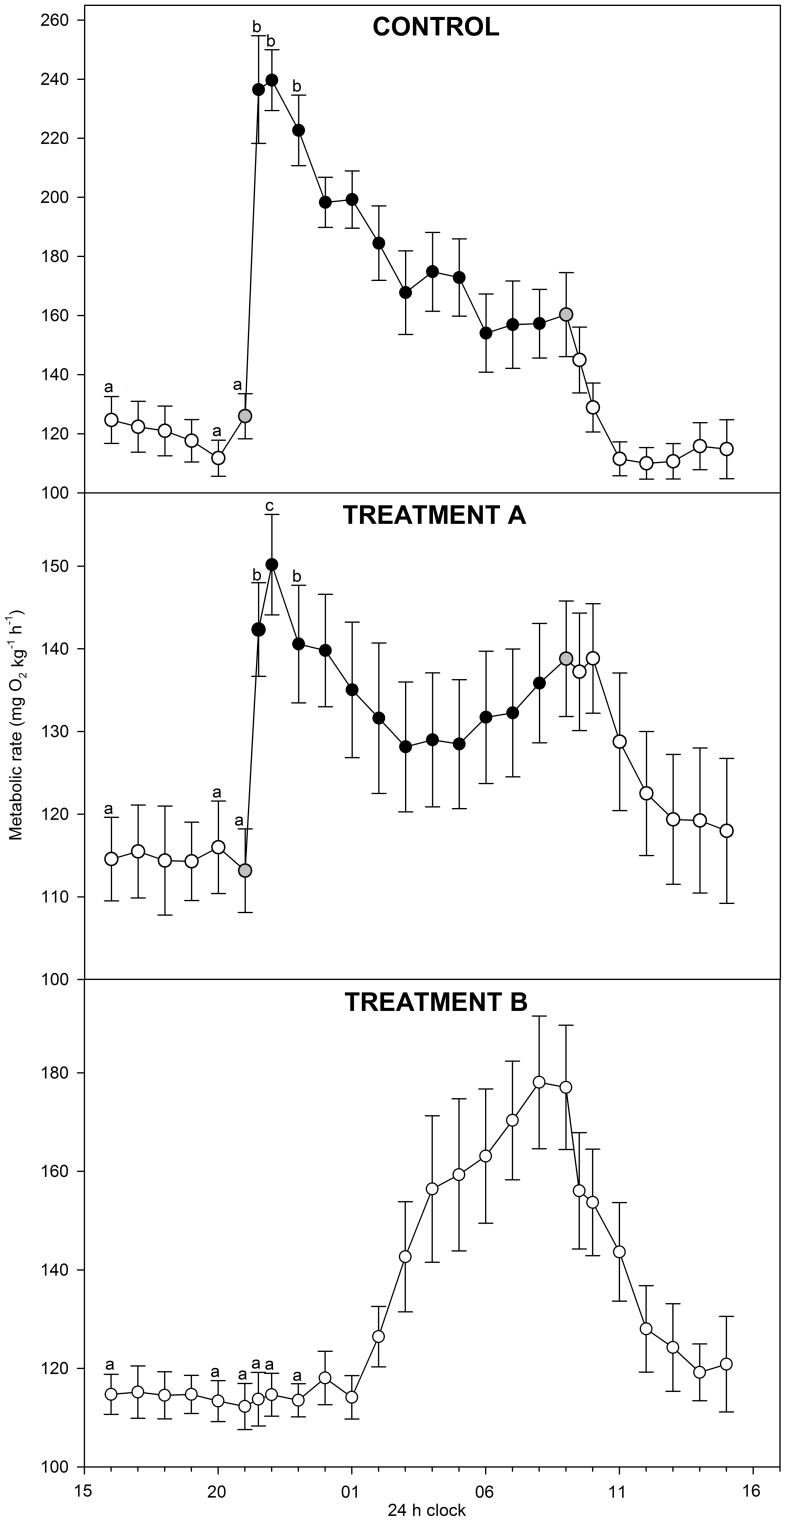
Figure 1. Metabolic rates (mg O2 kg−1 h−1) over 24 h in lake sturgeon Acipenser fulvescens.
Data collection comprised three test groups: control (100% O2sat; 12L∶12D), treatment A (30% O2sat; 12L∶12D), and treatment B (100% O2sat; 24L). Colours of the symbols indicate light levels with white, black and grey data points representing light, dark and intermediate light levels, respectively. Different letters indicate significant (P<0.05) differences between measurements within each test group. Note that y-axes differ between the three panels.

