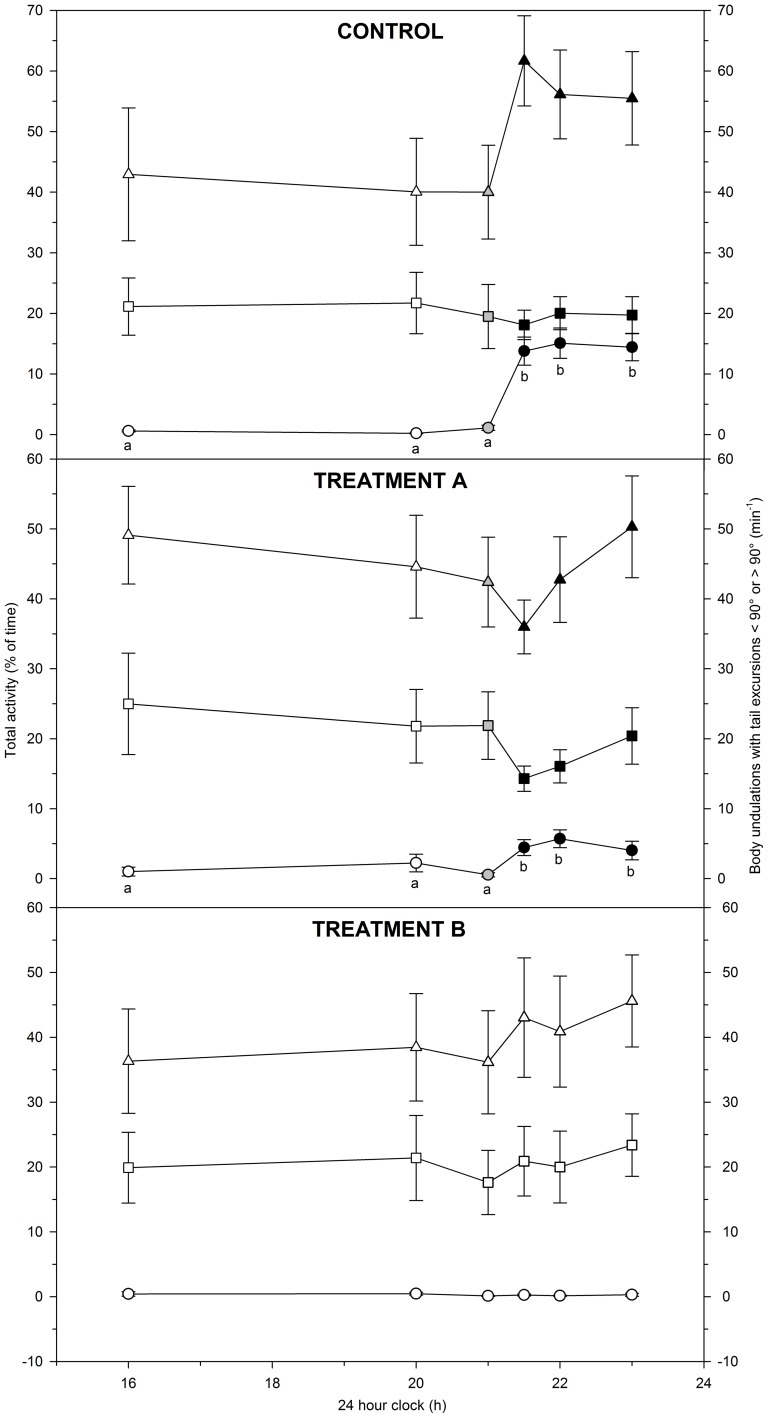
Figure 2. Hourly behavioural variables in lake sturgeon Acipenser fulvescens from 16:00 h to 23:00 h.
Data collection comprised three test groups: control (100% O2sat; 12L∶12D), treatment A (30% O2sat; 12L∶12D), and treatment B (100% O2sat; 24L). Colours of the symbols indicate light levels with white, black and grey data points representing light, dark and intermediate light levels, respectively. Behavioural variables included total activity (% of time moving) (triangles) and the frequencies of body undulations with tail excursions<90° (squares) or >90° (circles) (min−1). Within each test group, behavioural variables were compared over time to identify significant changes. Different letters indicate significant (P<0.05) changes over time, whereas identical or no letters indicate non-significant (P>0.05) changes over time.

