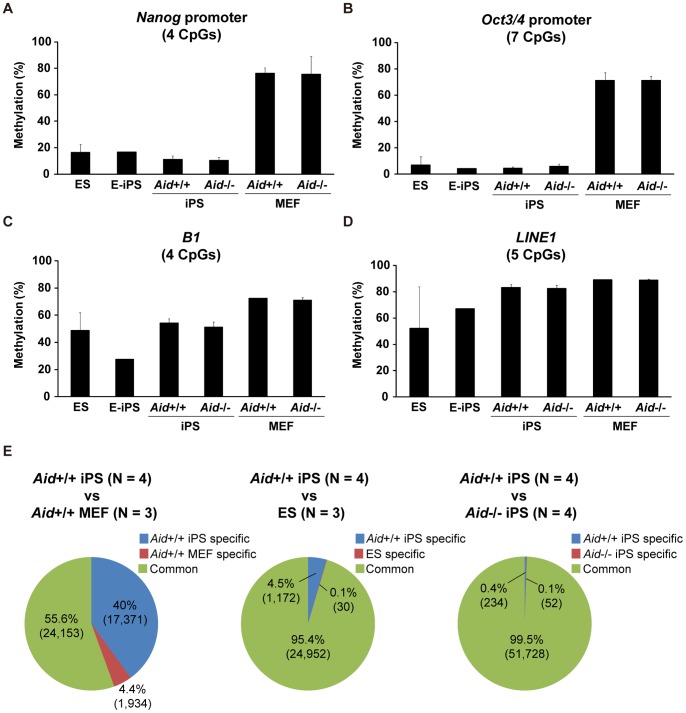
Figure 3. The DNA methylation status of Aid −/− iPS cells.
(A–D) The DNA methylation status of the Nanog promoter (A), Oct3/4 promoter (B), B1 (C) and LINE1 (D) detected by pyrosequencing. The iPS cell clones analyzed were the same as those examined in Fig. 2C. The data are represented as the averages ± SD of the clones. (E) The results of the comprehensive DNA methylation analysis with MBD-sequencing. Pie charts show the comparison of the detected methylated regions between Aid +/+ iPS cells and Aid +/+ MEFs (left), Aid +/+ iPS cells and ES cells (middle), and Aid +/+ iPS cells and Aid −/− iPS cells (right). DMRs; Differentially methylated regions, CMRs; Commonly methylated regions.

