
Figure 3.
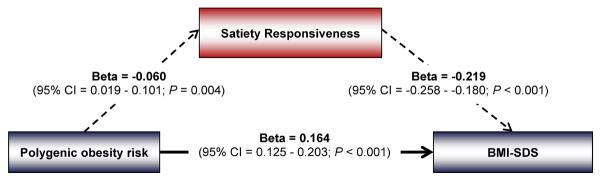
Path diagram showing that Satiety Responsiveness significantly mediates the association between polygenic risk of obesity and BMI-SDS. The path diagram shows the simple association between the polygenic risk score (PRS) and Satiety Responsiveness (beta, −0.060; 95% CI, −0.101 to −0.019), the association between the PRS and BMI-SDS adjusted for Satiety Responsiveness (beta, 0.164; 95% CI, 0.125 to 0.203), and the association between Satiety Responsiveness and BMI-SDS adjusted for the PRS (beta, −0.219; 95% CI, −0.258 to −0.180). The simple association between the PRS and BMI-SDS (beta, 0.177; 95% CI, 0.136 to 0.218) was slightly higher than the association between the PRS and BMI-SDS adjusted for Satiety Responsiveness (beta Δ 0.013), indicating that Satiety Responsiveness mediated part of the association. The Sobel test confirmed that Satiety Responsiveness significantly mediated the association between the PRS and BMI-SDS (P=0.006).