
Figure 2.
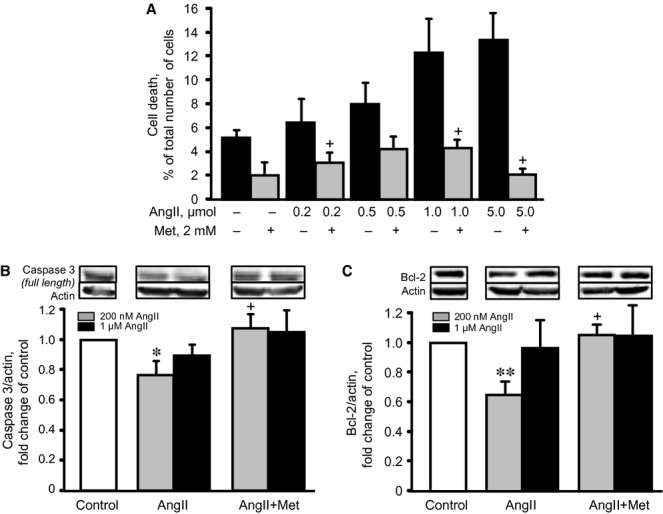
The effects of metformin (Met) on AngII-induced cell death. (A) The effect of AngII (24 hrs), at concentrations ranging from 0 to 5 μM, on cell death, in the presence or absence of 2 mM Met was measured by Trypan blue. (B and C) The effects of Met on caspase 3 (full size) and Bcl-2 protein levels in cells treated with 200 nM or 1 μM AngII. *P < 0.05, **P < 0.01 versus control; +P < 0.05 versus AngII. n = 3–4 per group (for apoptotic proteins) and 6–8 (for cell death) per group.