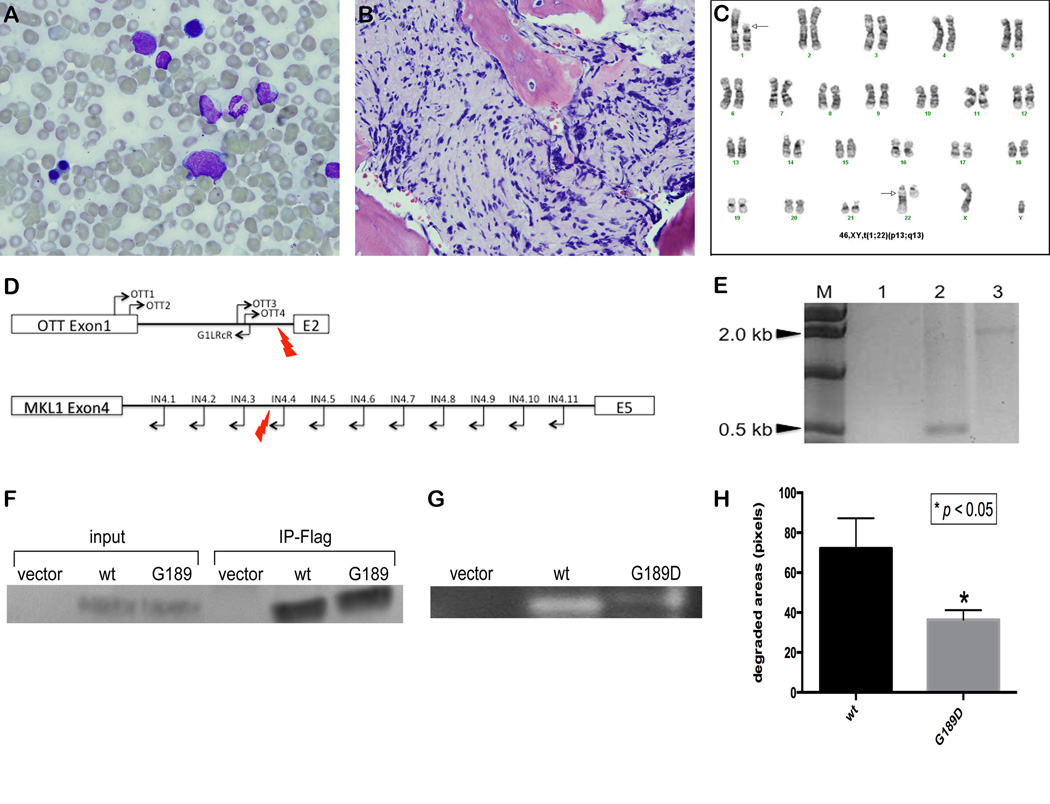
Figure 1.
Analysis of t(1;22) sample and functional analysis of MMP8G189D. (A) and (B) show two blasts (arrows) from a touch-prepped bone marrow (original magnification 100×) and severe fibrosis in bone marrow core (original magnifications 50×), respectively. (C) shows G banded karyotype with t(1;22)(p13;q13) at diagnosis from the patient. Arrows indicate the rearranged chromosomes. (D) Diagram of primer bound locations on OTT gene and MKL1 gene. Red lightening symbols indicate the break point. (E) PCR amplicon of OTT4/IN4.3 was not observed in lane 1 but PCR amplicons of OTT4/IN4.4 and OTT4/IN4.5 were observed at around 500 bp and 2.2 kb, in lane 2 and 3, respectively. This analysis indicated that the breakpoint is between IN4.3 and IN4.4 in MKL1 intron 4. (F) Western blot was probed with anti-Flag antibody on the whole cell lysates and immunoprecipitates by flag beads of HEK 293T cells carrying with empty vector (empty), wild-type (wt) and mutant (G189D) MMP8. (G) Type 1 collagen substrate zymography showed the reduced enzymatic activity of mutant MMP8 (G189D) compared to wild-type MMP8 (wt). (H) The degraded areas by MMP8 were calculated using ImageJ.

