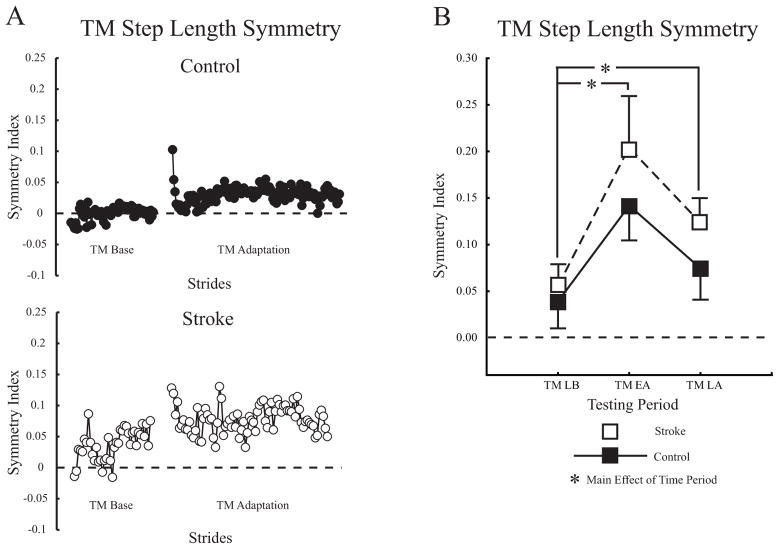
Figure 2.
A. Step length symmetry during treadmill walking plotted on a stride-by-stride basis for a typical control and participant with stroke. Each circle represents the average of three consecutive strides. B. Group average step length symmetry changes across treadmill conditions for all participants. Treadmill Late Baseline (TM LB), Treadmill Early Adaptation (TM EA), Treadmill Late Adaptation (TM LA). The dashed horizontal line in all plots indicates perfect symmetry. Asterisks indicate significance level of p <0.05 from post hoc analyses of each condition vs. late baseline for the main effect of testing period. Error bars ± 1 SEM.

