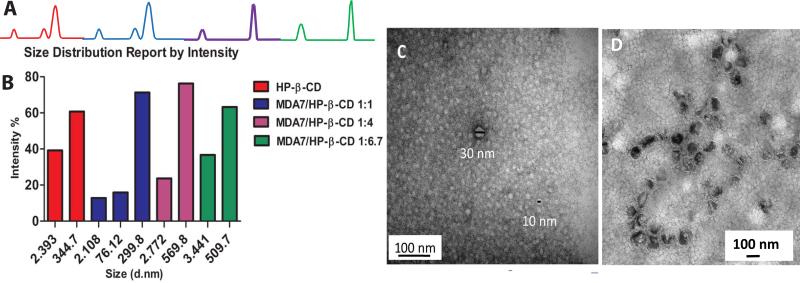
Figure 7.
A, DLS results showing size distribution by intensity of the aqueous solutions of HPβCD and MDA7:HPβCD at 1:1, 1:4 and 1:6.7 molar ratio; B, Flow charts corresponding to the size distribution by intensity; C, TEM images of aggregated 230 mM 1:6.7 MDA7:HPβCD; D, TEM images of MDA7 in liposomal dispersions.

