
Fig. 4.
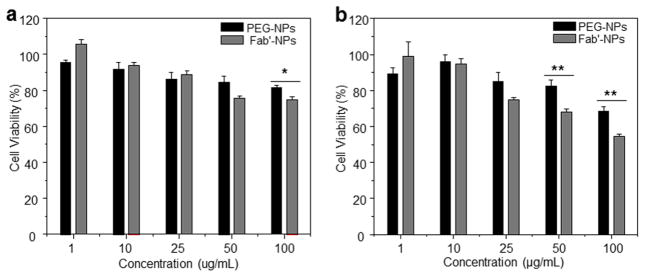
Cytotoxicity assays of PEG-NPs and Fab′-NPs at different concentrations in Colon-26 (a) and RAW 264.7 (b) cell lines. Triton X-100 was used as the positive control to produce a maximum cell death rate (100%). Cell culture medium was used as a negative control (death rate defined as 0%). Toxicity is given as the percentage of viable cells remaining after treatment for 24 h. Each point represents the mean ± S.E.M. (n=5). Statistical significance was assessed using Student’s t-test (*P<0.05 and **P<0.01).