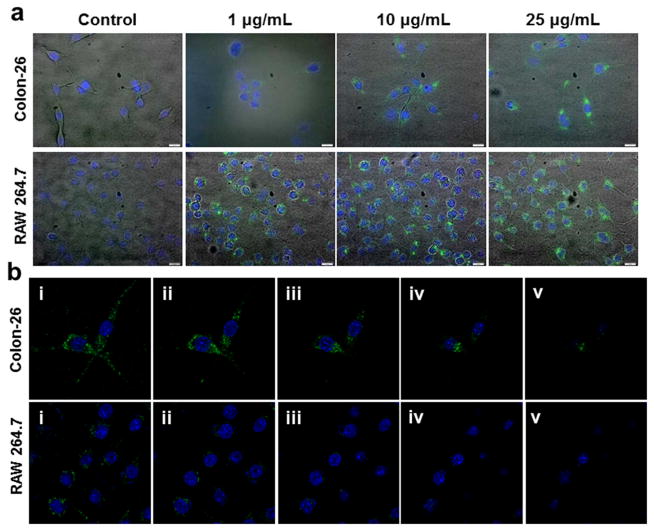
Fig. 5.
(a) Images of cellular uptake of different concentrations of Fab′-NPs by Colon-26 and RAW 264.7 cells. Cells were treated with NPs for 6 h and processed for fluorescence staining. Fixed cells were stained with DAPI (purple) for visualization of nuclei. Scale bar represents 10 μm. (b) Serial optical sections acquired from the top to the bottom of the samples at a defined thickness of 11 μm. Colon-26 and RAW 264.7 cells were incubated with Fab-NPs (25 μg/mL) for 6 h, fixed with 4% paraformaldehyde solution, and then stained with DAPI (purple) for visualization of nuclei.

