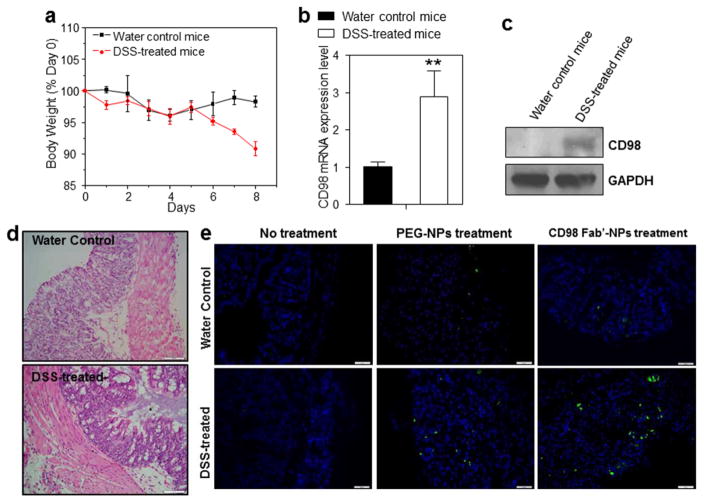
Fig. 8.
Ex vivo tissue uptake profiles of PEG-NPs and Fab′-NPs. (a) Changes in body weight over time in mice treated with 3% DSS in drinking water. Mouse body weight was normalized to day 0 body weight (expressed as a percentage) and is depicted as the mean of each treatment group ± S.E.M. (n=5). (b) CD98 mRNA levels in healthy control mice and DSS-treated mice. Each point represents the mean ± S.E.M. (n=5). Statistical significance was assessed using Student’s t-test (*P<0.05 and **P<0.01). (c) Western blotting of total colonic lysates from healthy control mice and DSS-treated mice. Total colonic protein (50 μg/lane) was resolved by SDS-PAGE on 4–15% gradient gels under reducing conditions followed by transfer to a nitrocellulose membrane. The blot was immunostained with an anti-CD98 antibody. As a loading control, the same blot was stripped and reprobed with an antibody against GAPDH. (d) H&E-stained colon sections from healthy control and DSS-treated mice sacrificed on day 8. Scale bar represents 50 μm. (e) Tissue uptake profiles of PEG-NPs and Fab′-NPs after co-incubating for 6 h with healthy control tissue or colitis tissue. Tissues were treated with NPs (100 μg/mL) and processed for fluorescence staining. Fixed cells were stained with DAPI for visualization of nuclei (purple). Scale bar represents 50 μm.

