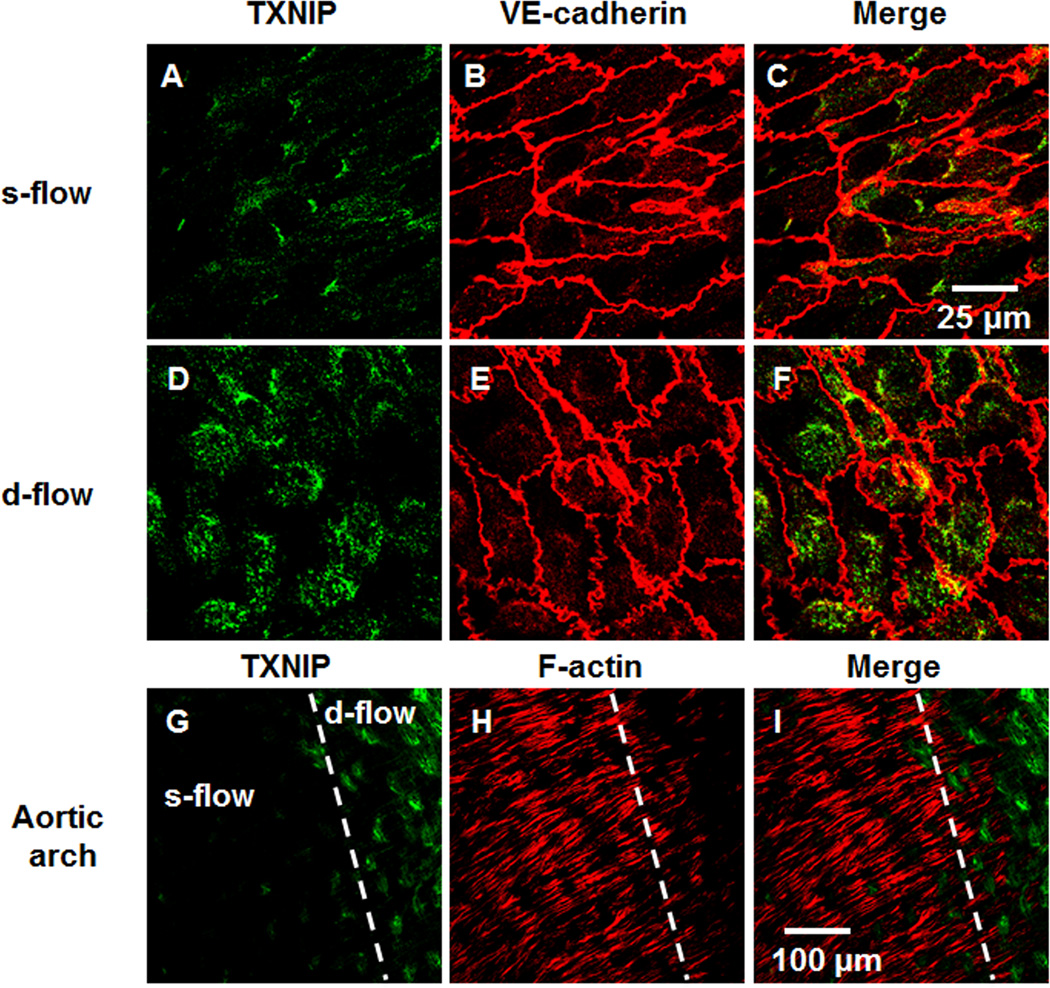
Figure 6. En face staining demonstrates flow regulation of TXNIP and stress fiber formation.
s-flow (A–C) and d-flow (D–F) regions of animals demonstrate differential TXNIP expression (A, D), VE-cadherin (B, E) or presented as merged images (C, F). Aortic arch immuno-staining for TXNIP (G), F-actin (H) or presented as merged image (I) demonstrating both s-flow and d-flow regions as indicated by the broken white line.

