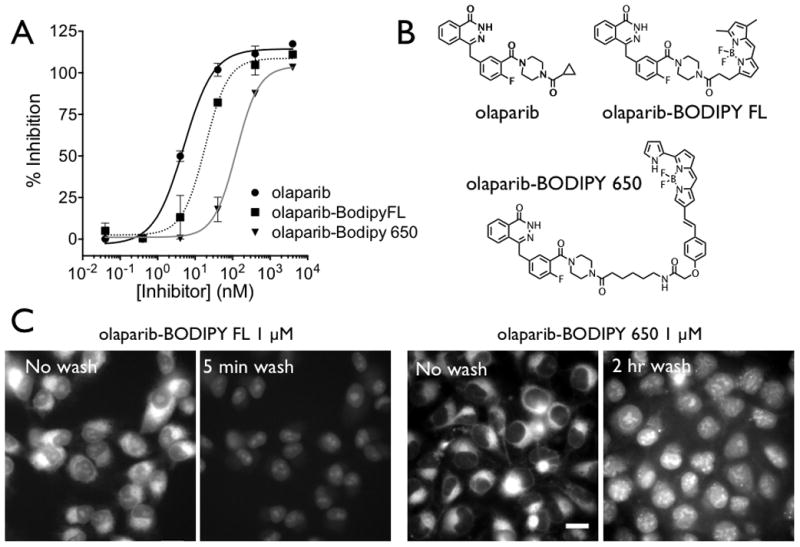
Figure 1. Molecular Properties and Cellular Imaging.

(A) The measured inhibitory concentrations of the three PARP inhibitors with the structure shown in (B). (C) In vitro images of olaparib-BODIPY FL and olaparib-BODIPY 650 show similar patterns of uptake. Before washing, the majority of the probe is located in the perinuclear endoplasmic reticulum, and after washing, the nuclear signal (with higher PARP concentrations in the nucleolus) is more prominent. The kinetics of distribution are significantly different between the two probes, with the olaparib-BODIPY 650 rates around 10 times slower. The ratio of uptake in the ER to the nucleus before washing is also much higher with the olaparib-BODIPY 650 probe. The contrast is identical for olaparib-BODIPY FL before and after the wash, but the contrast was increased after 2 hrs of washing to show the nuclear specific staining which is much lower than the perinuclear signal before washing (Figure S2) Scale bar = 20 μm
