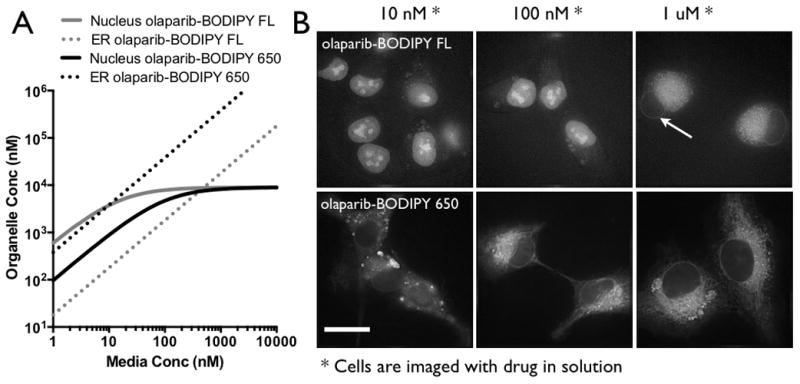
Figure 2. Specific Cell Uptake.

(A) A simple equilibrium model derived from the kinetic data predicts that the olaparib-BODIPY FL yields a higher nuclear signal at low concentrations and higher ER signal at high concentrations. The greater uptake in the ER for olaparib-BODIPY 650 indicates that at equilibrium, the ER signal will always be higher than the nucleus. (B) Widefield fluorescence images of the cells in equilibrium with probe in the media are consistent with the equilibrium model. Note that the image contrast was changed between the different concentrations due to the order of magnitude difference in signal intensity. Arrow points to lower uptake in nucleus. Scale bar = 20 μm
