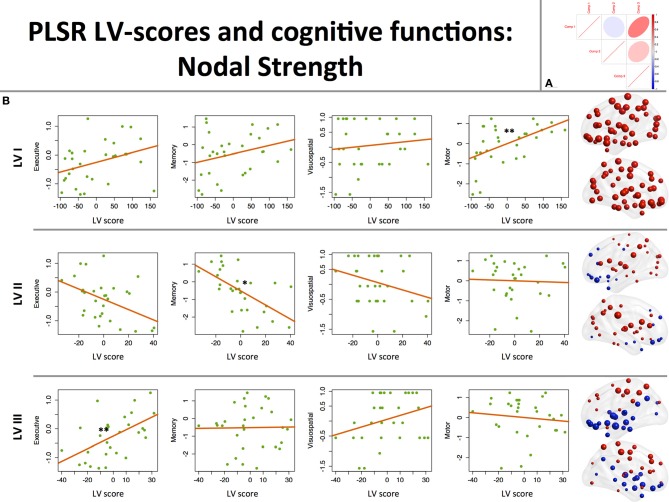
Figure 1.
Associations between component scores and behavioral data: nodal strength. (A) Between-component correlation plot. Positive association (r = 0.5) was found between latent variables (LVs) I and III. (B) Associations between LV scores extracted from the nodal strength data and performance in 3 cognitive (executive, memory, visuospatial) and motor domains. On the right-hand side of the graph, corresponding loading maps are depicted in brain space, reflecting the relevance of the nodes (spheres) for a particular LV, the magnitude of which is represented by nodal size. Positive loading values are depicted as red spheres, whereas negative ones are shown in blue. *p < 0.05, **p < 0.01.

