Figure 4.

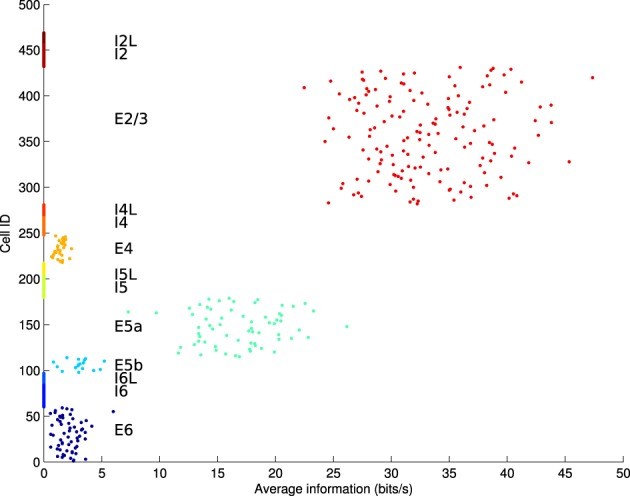
Average information contribution (in bits/s) per cell over 20 runs, arranged by cell population. Only excitatory cell populations were tested. E2/3 is the layer with the highest information contribution, followed by E5a.

Average information contribution (in bits/s) per cell over 20 runs, arranged by cell population. Only excitatory cell populations were tested. E2/3 is the layer with the highest information contribution, followed by E5a.