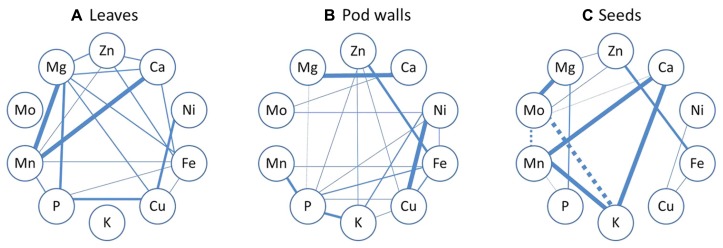
FIGURE 7.
Mineral correlation analysis. Pearson’s correlation analysis of ten mineral concentrations in leaves (A), pod walls (B), and seeds (C) of Thorne and 392-3 soybean plants cultivated with 10, 32, or 100 μM of Fe (III)-EDDHA and measured at two grain filling stages (GF I and GF II) or at full maturity (FM). Solid lines represent a significant positive correlation and dashed lines represent a significant negative correlation. Thinner lines indicate significance at the P < 0.05, semi-thin indicate significance at the P < 0.01, semi-thick indicate significance at the P < 0.001 level and the thicker lines indicate significance at the P < 0.0001 level.

