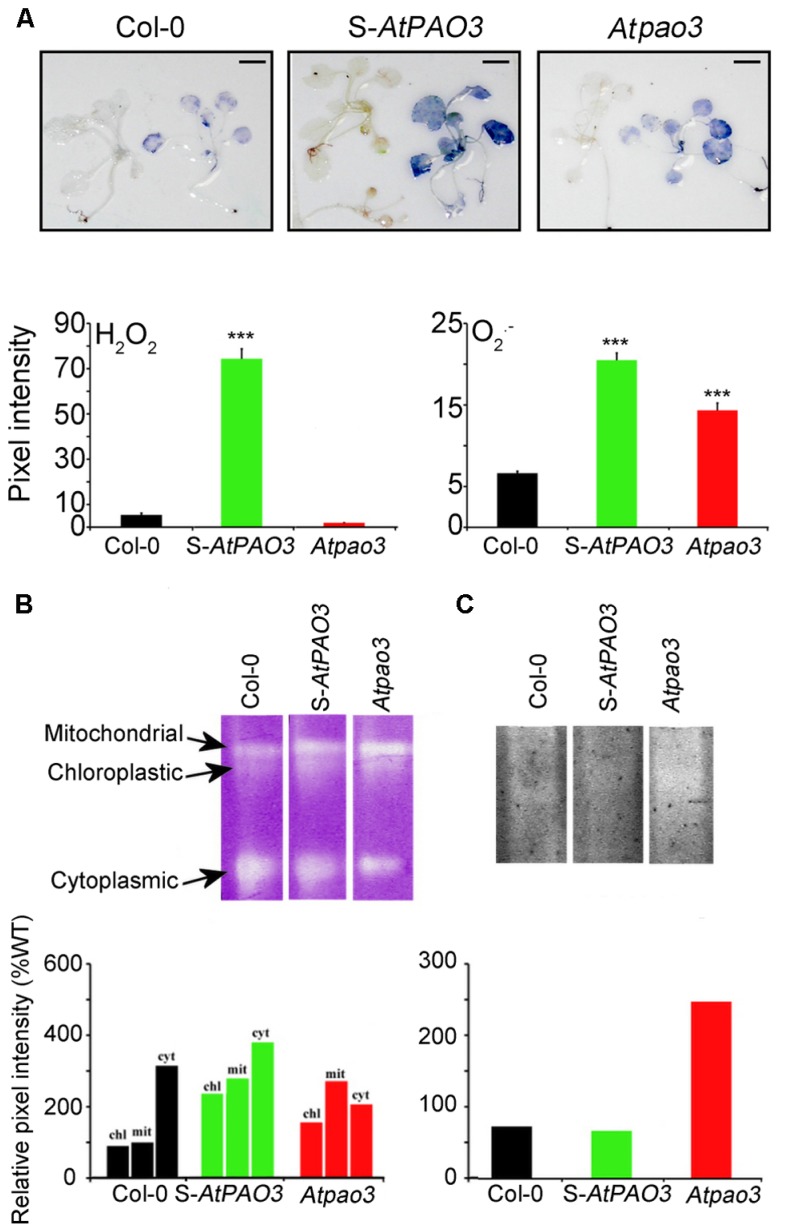
FIGURE 4.
In situ ROS in WT, S-AtPAO3, and Atpao3 Arabidopsis plants. (A) In situ ROS detection in WT, S-AtPAO3 and Atpao3 plants. Data are from a single representative experiment, repeated three times, and densitometric analysis. Data are the means of three different positions on a leave. Asterisks indicate statistical significant differences from the Col-0 (***P < 0.001). Scale bars, 2.8 cm. (B) Native electrophoresis and activity staining of SOD and densitometric analysis of isoenzymes. (C) Native electrophoresis and activity staining of APX and densitometric analysis.

