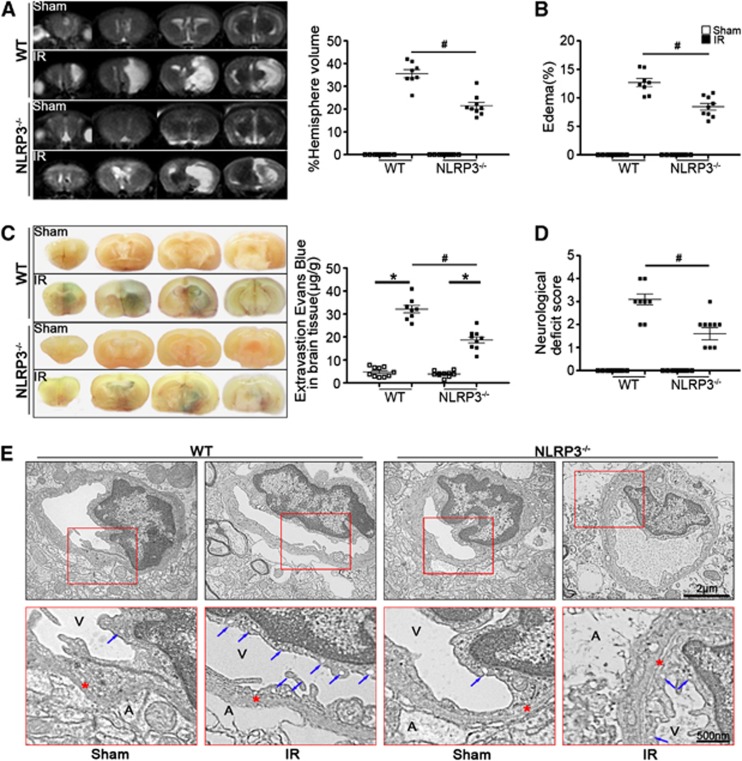
Figure 2.
NLRP3 deficiency ameliorated stroke outcomes. (A) Representative T2 images measured and quantified infarct volume with magnetic resonance imaging (MRI) in wild-type (WT) and NLRP3−/− mice at 24 hours of reperfusion after middle cerebral artery occlusion (MCAO). (B) Calculated cerebral edema in WT and NLRP3−/− mice at 24 hours of reperfusion after MCAO. (C) Representative microscopic images of brain sections after injection of Evans blue and measured Evans blue intensity in WT and NLRP3−/−mice at 24 hours of reperfusion after MCAO. (D) Neurologic deficit scores in WT and NLRP3−/− mice at 24 hours of reperfusion after MCAO. (E) Transmission electronic microscope analysis of the blood–brain barrier (BBB) integrity showing that in ischemic WT mice, the endothelial cells and their nucleus were swollen and deformed, and the integrity of BBB was destroyed, presenting perivascular edema, vacuolation (blue arrows indicated), and membrane (red stars indicated) damage. A represents astrocytes; V represents blood vessel; n=8 to 10 animals per group.*P<0.05 vs. sham-operated mice and #P<0.05 vs. WT ischemic mice. IR, ischemia reperfusion.

