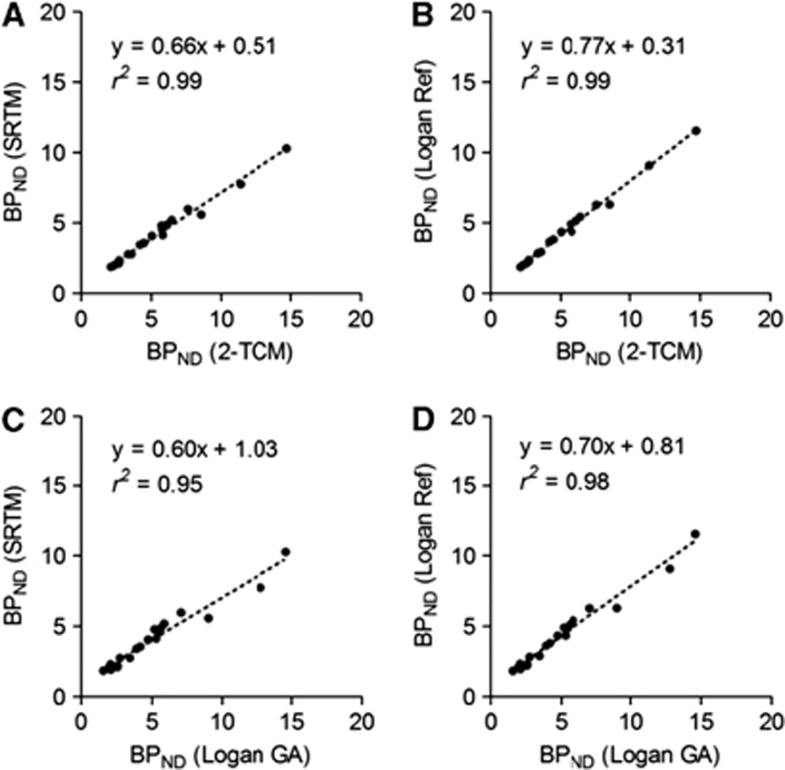
Figure 3.
Scatter plots indicating relationship between binding potential (BPND) values based on reference tissue methods and those based on blood sampling methods in positron emission tomography (PET) studies of normal Sprague-Dawley (SD) rats (n=4). (A) Simplified reference tissue model (SRTM) versus two-tissue compartment model (2-TCM). (B) Logan reference (Logan Ref) versus 2-TCM. (C) SRTM versus Logan graphical analysis (Logan GA). (D) Logan Ref versus Logan GA.

