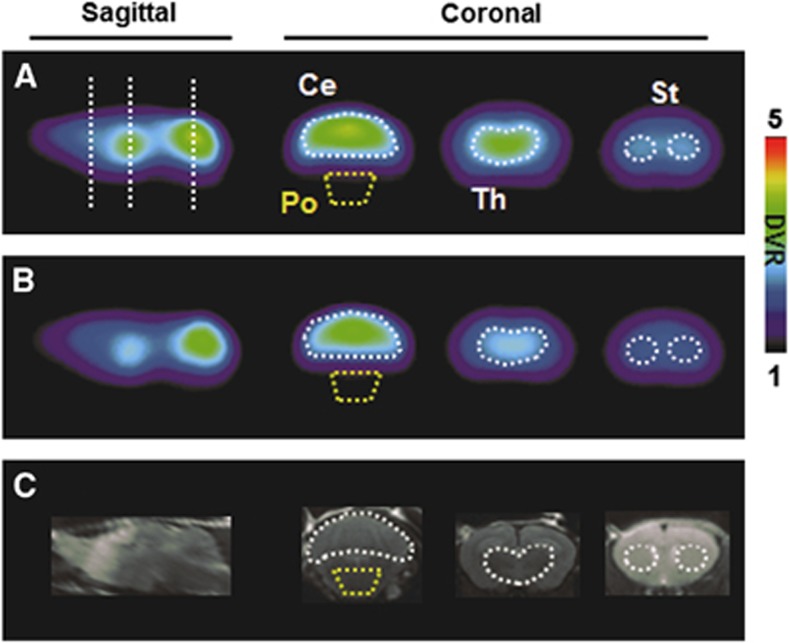
Figure 4.
Representative [11C]ITDM-PET images of the brains of noncarrier (A) and R6/2 (B) mice and magnetic resonance imaging (MRI) templates of mouse brain (C). The PET images displayed here reflect the radioactivity summed from 0 to 90 minutes after injection. Abbreviations are as follows: Ce, cerebellum; Po, pons; Th, thalamus; St, striatum. The color scale represents the distribution volume ratio (DVR). [11C]ITDM, N-[4-[6-(isopropylamino)-pyrimidin-4-yl]-1,3-thiazol-2-yl]-N-methyl-4-[11C]-methylbenzamide; PET, positron emission tomography.

