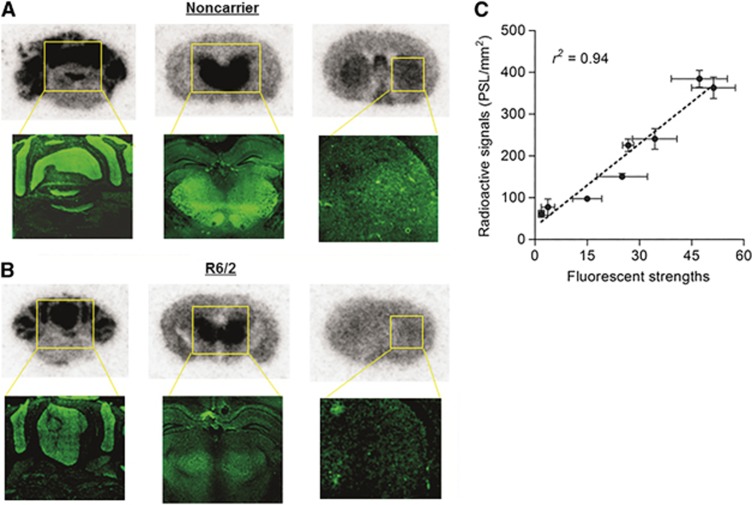
Figure 6.
Comparison between autoradiographs (top) with [11C]ITDM and immunohistochemical images (bottom) in the noncarrier (A) and R6/2 (B) mouse brain sections and correlation between radioactive signal intensity and fluorescence strength obtained by scatter plot (C). Data are expressed as means±s.d. (n=3 slides in each anatomic level). [11C]ITDM, N-[4-[6-(isopropylamino)-pyrimidin-4-yl]-1,3-thiazol-2-yl]-N-methyl-4-[11C]-methylbenzamide; PSLs, photostimulated luminescence values.

