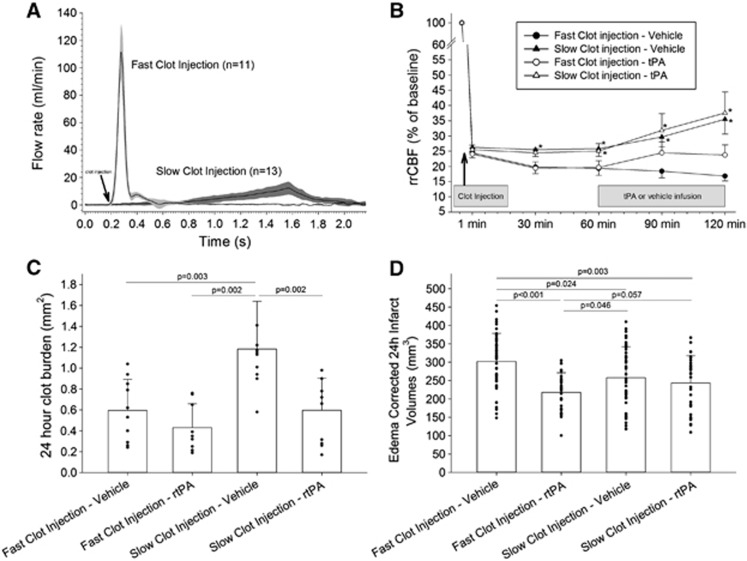
Figure 1.
(A) Flow rate curves in slow versus fast clot injection (CI). Arrow denotes start of CI. (B) Relative regional cerebral blood flow (rrCBF) as assessed by laser Doppler flowmetry in animals subjected to fast versus slow CI. *P<0.05 versus fast CI vehicle group. (C) At 24 hours after CI, significantly less clot material was visualized in the circle of Willis and dependent arteries of vehicle animals subjected to fast versus slow CI. Treatment with recombinant tissue plasminogen activator (rtPA) significantly reduced clot burden in slow CI but not in fast CI animals (P=0.195). (D) Comparison of final infarct volumes between experimental groups.

